eBay 2007 Annual Report Download - page 66
Download and view the complete annual report
Please find page 66 of the 2007 eBay annual report below. You can navigate through the pages in the report by either clicking on the pages listed below, or by using the keyword search tool below to find specific information within the annual report.-
 1
1 -
2
-
3
-
4
-
5
-
6
-
7
-
8
-
9
-
10
-
11
-
12
-
13
-
14
-
15
-
16
-
17
-
18
-
19
-
20
-
21
-
22
-
23
-
24
-
25
-
26
-
27
-
28
-
29
-
30
-
31
-
32
-
33
-
34
-
35
-
36
-
37
-
38
-
39
-
40
-
41
-
42
-
43
-
44
-
45
-
46
-
47
-
48
-
49
-
50
-
51
-
52
-
53
-
54
-
55
-
 56
56 -
 57
57 -
 58
58 -
 59
59 -
 60
60 -
 61
61 -
 62
62 -
 63
63 -
 64
64 -
 65
65 -
 66
66 -
 67
67 -
 68
68 -
 69
69 -
 70
70 -
 71
71 -
 72
72 -
 73
73 -
 74
74 -
 75
75 -
 76
76 -
77
-
78
-
79
-
80
-
81
-
82
-
83
-
84
-
85
-
86
-
87
-
88
-
89
-
90
-
91
-
92
-
93
-
94
-
95
-
96
-
97
-
98
-
99
-
100
-
101
-
102
-
103
-
104
-
105
-
106
-
107
-
108
-
109
-
110
-
111
-
112
-
113
-
114
-
115
-
116
-
117
-
118
-
119
-
120
-
121
-
122
-
123
-
124
-
125
-
126
-
127
-
128
 |
 |

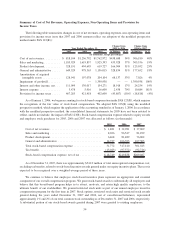
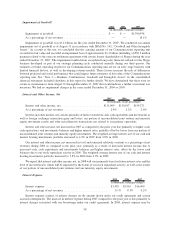
increased $222.5 million in 2007 compared to the prior year, due to an increase in global television and online
marketing campaigns. Employee-related costs and the use of contractors increased by $48.7 million in 2007 as we
continued to expand our domestic and international operations. Sales and marketing expenses as a percentage of net
revenues decreased from 2006, due to more efficient spending within our Marketplaces segment as we continued to
refine our marketing programs and the growth in our Payments and Communications segments, each of which has
lower relative sales and marketing expenses than our Marketplaces segment.
Sales and marketing expenses increased in total and as a percentage of total net revenues in 2006 due to our
continued investment in growing our global user base and the effect of stock-based compensation expense related to
equity awards and employee stock purchases under FAS 123(R). Growth in advertising and marketing costs as well
as employee-related costs comprised the majority of the increases. Combined advertising and marketing costs
increased $250.5 million in 2006 compared to the prior year, due to an increase in global television and online
marketing campaigns. Employee-related costs, not including stock-based compensation expense, increased by
$69.3 million in 2006 as we continued to expand our domestic and international operations. Stock-based
compensation expense of $96.5 million was included in sales and marketing expense in 2006 compared to
$8.7 million in 2005. Stock-based compensation expense increased due to our implementation of FAS 123(R) at the
beginning of 2006.
For 2008, sales and marketing expense is expected to increase in total due to our increased efforts to retain
existing active users and increase activity across all of our segments. However, sales and marketing expense as a
percentage of net revenues is expected to decrease slightly due to improved sales and marketing expense leverage in
our Marketplaces segment and the relative growth in our Payments and Communications segments (each of which
has lower sales and marketing expenses than our Marketplaces segment).
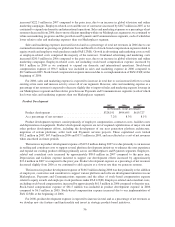
Product Development
2005 2006 2007
(in thousands, except percentages)
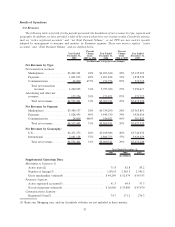
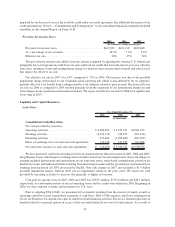
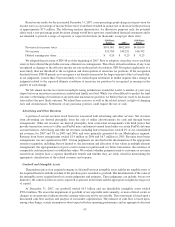
Product development ................................ $328,191 $494,695 $619,727
As a percentage of net revenues ........................ 7.2% 8.3% 8.1%
Product development expenses consist primarily of employee compensation, contractor costs, facilities costs
and depreciation on equipment. Product development expenses are net of required capitalization of major site and
other product development efforts, including the development of our next generation platform architecture,
migration of certain platforms, seller tools and Payments services projects. These capitalized costs totaled
$81.2 million in 2007, $67.9 million in 2006 and $37.1 million in 2005, and are reflected as a cost of net revenues
when amortized in future periods.
The increase in product development expense of $125.0 million during 2007 was due primarily to an increase
in staffing and consultant costs to support several platform development initiatives to enhance the user experience
and expand our existing product offerings primarily across our Marketplaces and Payments segments. Employee-
related and consultant costs increased by approximately $89.0 million in 2007 compared to the prior year.
Depreciation and facilities expense incurred to support our development efforts increased by approximately
$15.6 million in 2007 as compared to the prior year. Product development expense as a percentage of net revenues
decreased slightly from 2006 as we continued to add capacity at a slower rate than we generate revenue.
The increase in product development expense of $166.5 million during 2006 was due primarily to the addition
of employees, contractors and consultants to support various platform and software development initiatives in our
Marketplaces, Payments and Communications segments and the effect of stock-based compensation expense
related to equity awards and employee stock purchases under FAS 123(R). Employee-related and consultant costs,
excluding stock-based compensation, increased by approximately $61.5 million in 2006 compared to the prior year.
Stock-based compensation expense of $81.5 million was included in product development expense in 2006
compared to $6.5 million in 2005. Stock-based compensation expense increased due to our implementation of
FAS 123(R) at the beginning of 2006.
For 2008, product development expense is expected to increase in total and as a percentage of net revenues as
we develop new site features and functionality and invest in strategic product-based initiatives.
56