eBay 2004 Annual Report Download - page 111
Download and view the complete annual report
Please find page 111 of the 2004 eBay annual report below. You can navigate through the pages in the report by either clicking on the pages listed below, or by using the keyword search tool below to find specific information within the annual report.-
 1
1 -
2
-
3
-
4
-
5
-
6
-
7
-
8
-
9
-
10
-
11
-
12
-
13
-
14
-
15
-
16
-
17
-
18
-
19
-
20
-
21
-
22
-
23
-
24
-
25
-
26
-
27
-
28
-
29
-
30
-
31
-
32
-
33
-
34
-
35
-
36
-
37
-
38
-
39
-
40
-
41
-
42
-
43
-
44
-
45
-
46
-
47
-
48
-
49
-
50
-
51
-
52
-
53
-
54
-
55
-
56
-
57
-
58
-
59
-
60
-
61
-
62
-
63
-
64
-
65
-
66
-
67
-
68
-
69
-
70
-
71
-
72
-
73
-
74
-
75
-
76
-
77
-
78
-
79
-
80
-
81
-
82
-
83
-
84
-
85
-
86
-
87
-
88
-
89
-
90
-
91
-
92
-
93
-
94
-
95
-
96
-
97
-
98
-
99
-
100
-
 101
101 -
 102
102 -
 103
103 -
 104
104 -
 105
105 -
 106
106 -
 107
107 -
 108
108 -
 109
109 -
 110
110 -
 111
111 -
 112
112 -
 113
113 -
 114
114 -
 115
115 -
 116
116 -
 117
117 -
 118
118 -
 119
119 -
 120
120 -
 121
121 -
122
-
123
-
124
-
125
-
126
-
127
-
128
-
129
-
130
-
131
-
132
-
133
-
134
 |
 |

eBay Inc.
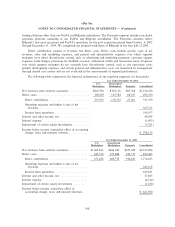
NOTES TO CONSOLIDATED FINANCIAL STATEMENTS Ì (Continued)
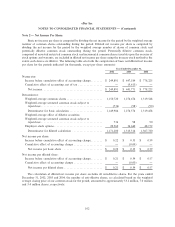
Year Ended December 31, 2004
U.S. International
Marketplace Marketplace Payments Consolidated
Net revenues from external customers ÏÏÏÏÏÏÏÏÏÏÏÏÏ $1,399,848 $1,173,759 $697,702 $3,271,309
Direct costs ÏÏÏÏÏÏÏÏÏÏÏÏÏÏÏÏÏÏÏÏÏÏÏÏÏÏÏÏÏÏÏÏÏÏÏ 465,834 473,239 371,621 1,310,694
Direct contribution ÏÏÏÏÏÏÏÏÏÏÏÏÏÏÏÏÏÏÏÏÏÏÏÏÏÏÏ 934,014 700,520 326,081 1,960,615
Operating expenses and indirect costs of net
revenues ÏÏÏÏÏÏÏÏÏÏÏÏÏÏÏÏÏÏÏÏÏÏÏÏÏÏÏÏÏÏÏÏÏÏ 901,373
Income from operations ÏÏÏÏÏÏÏÏÏÏÏÏÏÏÏÏÏÏÏÏÏÏÏ 1,059,242
Interest and other income, net ÏÏÏÏÏÏÏÏÏÏÏÏÏÏÏÏÏÏÏ 77,867
Interest expenseÏÏÏÏÏÏÏÏÏÏÏÏÏÏÏÏÏÏÏÏÏÏÏÏÏÏÏÏÏÏÏÏ (8,879)
Impairment of certain equity investments ÏÏÏÏÏÏÏÏÏÏ Ì
Income before income cumulative eÅect of
accounting change, taxes and minority interests ÏÏÏ $1,128,230
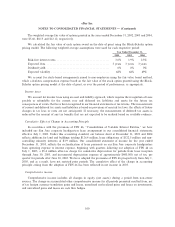
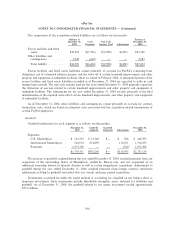
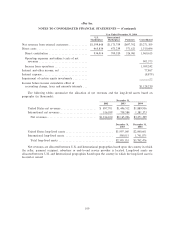
The following tables summarize the allocation of net revenues and the long-lived assets based on
geography (in thousands):
December 31,
2002 2003 2004
United States net revenues ÏÏÏÏÏÏÏÏÏÏÏÏÏÏÏÏÏÏÏÏÏÏÏÏÏ $ 897,701 $1,406,512 $1,889,936
International net revenuesÏÏÏÏÏÏÏÏÏÏÏÏÏÏÏÏÏÏÏÏÏÏÏÏÏÏ 316,399 758,584 1,381,373
Net revenuesÏÏÏÏÏÏÏÏÏÏÏÏÏÏÏÏÏÏÏÏÏÏÏÏÏÏÏÏÏÏÏÏÏÏÏ $1,214,100 $2,165,096 $3,271,309
December 31, December 31,
2003 2004
United States long-lived assets ÏÏÏÏÏÏÏÏÏÏÏÏÏÏÏÏÏÏÏÏÏÏÏÏÏÏÏÏÏÏÏÏÏ $1,997,140 $2,040,601
International long-lived assets ÏÏÏÏÏÏÏÏÏÏÏÏÏÏÏÏÏÏÏÏÏÏÏÏÏÏÏÏÏÏÏÏÏÏ 598,013 1,741,875
Total long-lived assets ÏÏÏÏÏÏÏÏÏÏÏÏÏÏÏÏÏÏÏÏÏÏÏÏÏÏÏÏÏÏÏÏÏÏÏÏÏÏ $2,595,153 $3,782,476
Net revenues are allocated between U.S. and International geographies based upon the country in which
the seller, payment recipient, advertiser or end-to-end service provider is located. Long-lived assets are
allocated between U.S. and International geographies based upon the country in which the long-lived asset is
located or owned.
109