Whirlpool 2009 Annual Report Download - page 98
Download and view the complete annual report
Please find page 98 of the 2009 Whirlpool annual report below. You can navigate through the pages in the report by either clicking on the pages listed below, or by using the keyword search tool below to find specific information within the annual report.-
 1
1 -
2
-
3
-
4
-
5
-
6
-
7
-
8
-
9
-
10
-
11
-
12
-
13
-
14
-
15
-
16
-
17
-
18
-
19
-
20
-
21
-
22
-
23
-
24
-
25
-
26
-
27
-
28
-
29
-
30
-
31
-
32
-
33
-
34
-
35
-
36
-
37
-
38
-
39
-
40
-
41
-
42
-
43
-
44
-
45
-
46
-
47
-
48
-
49
-
50
-
51
-
52
-
53
-
54
-
55
-
56
-
57
-
58
-
59
-
60
-
61
-
62
-
63
-
64
-
65
-
66
-
67
-
68
-
69
-
70
-
71
-
72
-
73
-
74
-
75
-
76
-
77
-
78
-
79
-
80
-
81
-
82
-
83
-
84
-
85
-
86
-
87
-
 88
88 -
 89
89 -
 90
90 -
 91
91 -
 92
92 -
 93
93 -
 94
94 -
 95
95 -
 96
96 -
 97
97 -
 98
98 -
 99
99 -
 100
100 -
 101
101 -
 102
102 -
 103
103 -
 104
104 -
 105
105 -
 106
106 -
 107
107 -
 108
108 -
109
-
110
-
111
-
112
 |
 |
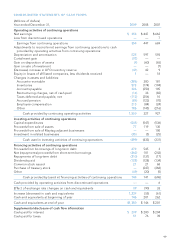
North America and Europe segments compared to 2007. Cash provided by continuing operations
also reflects lower accounts payable due to adjusting volume based on demand and higher pension
contributions. The above decreases in cash flows were partially offset by a decrease in accounts receivable
and lower restructuring spending.
Cash Flows from Investing Activities of Continuing Operations
Cash used in investing activities from continuing operations was an outflow of $499 million in 2009 com-
pared to an outflow of $433 million last year. The increase in cash used in investing activities was primarily
due to lower proceeds from the sale of assets in 2009 and higher investments primarily associated with
business acquisition activity in our international locations. Cash used in investing activities from continuing
operations in 2008 was an outflow of $433 million compared to an outflow of $331 million during 2007. The
increase in cash used in investing activities was primarily due to 2007 receipt of proceeds from the sale of
certain Maytag discontinued businesses of $100 million, lower proceeds from the sale of assets in 2008,
and higher capital spending.
The goal of our global operating platform is to enhance our competitive position in the global home
appliance industry by reducing costs, driving productivity and quality improvements, and accelerating our
rate of innovation. We plan to continue our comprehensive worldwide effort to optimize our regional
manufacturing facilities, supply base, product platforms and technology resources to better support
our global products, brands and customers. We intend to make additional investments to improve our
competitiveness in 2010. Capital spending is expected to be between $525 million and $575 million in 2010
in support of our investment in innovative product technologies and our global operating platform
initiatives.
Cash Flows from Financing Activities of Continuing Operations
Cash provided by financing activities from continuing operations for 2009 compared to 2008 was an inflow
of $144 million in the year ended December 31, 2009 compared to an inflow of $141 million for the year
ended December 31, 2008. The current year reflects proceeds received related to two debt offerings total-
ing $850 million while the prior year reflects proceeds received related to the issuance of $500 million of
5.5% notes due March 1, 2013. The current year also reflects net repayments of short-term borrowings and
long-term debt repayments totaling $572 million compared to net repayments of $30 million in 2008.
During 2009, we paid dividends to common stockholders totaling $128 million, paid debt financing fees of
$38 million and received proceeds from the issuance of common stock related to option exercises of $21
million. During 2008, we repurchased stock totaling $247 million, paid dividends to common stockholders
totaling $128 million and received proceeds from the issuance of common stock related to option exercises
of $21 million.
Cash provided by financing activities from continuing operations for 2008 compared to 2007 was an inflow
of $141 million in the year ended December 31, 2008 compared to an outflow of $696 million for the
year ended December 31, 2007. The year ended December 31, 2008 reflects proceeds received related to
the issuance of $500 million of 5.5% notes due March 1, 2013 and the repayment of $125 million of 9.1%
debentures. Net proceeds of short-term borrowings were $101 million for the year ended December 31,
2008 compared to net repayments of $243 million in 2007. During 2008, we repurchased stock totaling
$247 million, paid dividends to common stockholders totaling $128 million and received proceeds from the
issuance of common stock related to option exercises of $21 million. During 2007, we repurchased stock
totaling $368 million, paid dividends to common stockholders totaling $134 million and received proceeds
from the issuance of common stock related to option exercises of $68 million.
MA RK E T R IS K
We have in place an enterprise risk management process that involves systematic risk identification
and mitigation covering the categories of enterprise, strategic, financial, operation and compliance and
reporting risk. The enterprise risk management process receives Board of Directors and Management
oversight, drives risk mitigation decision-making and is fully integrated into our internal audit planning and
execution cycle.
We are exposed to market risk from changes in foreign currency exchange rates, domestic and foreign
interest rates, and commodity prices, which can affect our operating results and overall financial condition.
We manage exposure to these risks through our operating and financing activities and, when deemed
appropriate, through the use of derivative financial instruments. Derivative financial instruments are viewed
94