Whirlpool 2009 Annual Report Download - page 103
Download and view the complete annual report
Please find page 103 of the 2009 Whirlpool annual report below. You can navigate through the pages in the report by either clicking on the pages listed below, or by using the keyword search tool below to find specific information within the annual report.-
 1
1 -
2
-
3
-
4
-
5
-
6
-
7
-
8
-
9
-
10
-
11
-
12
-
13
-
14
-
15
-
16
-
17
-
18
-
19
-
20
-
21
-
22
-
23
-
24
-
25
-
26
-
27
-
28
-
29
-
30
-
31
-
32
-
33
-
34
-
35
-
36
-
37
-
38
-
39
-
40
-
41
-
42
-
43
-
44
-
45
-
46
-
47
-
48
-
49
-
50
-
51
-
52
-
53
-
54
-
55
-
56
-
57
-
58
-
59
-
60
-
61
-
62
-
63
-
64
-
65
-
66
-
67
-
68
-
69
-
70
-
71
-
72
-
73
-
74
-
75
-
76
-
77
-
78
-
79
-
80
-
81
-
82
-
83
-
84
-
85
-
86
-
87
-
88
-
89
-
90
-
91
-
92
-
 93
93 -
 94
94 -
 95
95 -
 96
96 -
 97
97 -
 98
98 -
 99
99 -
 100
100 -
 101
101 -
 102
102 -
 103
103 -
 104
104 -
 105
105 -
 106
106 -
 107
107 -
 108
108 -
 109
109 -
 110
110 -
 111
111 -
 112
112
 |
 |

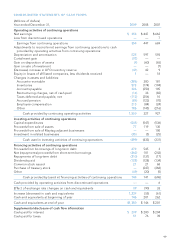
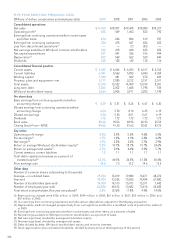
CON S OL IDAT E D S TATEM E N T S O F C A SH FLOW S
(Millions of dollars)
Year ended December 31, 2009 2008 2007
Operating activities of continuing operations
Net earnings $ 354 $ 447 $ 662
Loss from discontinued operations —— 7
Earnings from continuing operations 354 447 669
Adjustments to reconcile net earnings from continuing operations to cash
provided by operating activities from continuing operations:
Depreciation and amortization 525 597 593
Curtailment gain (92) — —
Gain on disposition of assets (4) (60) (65)
Gain on sale of investment —— (7)
(Decrease) increase in LIFO inventory reserve (41) 42 9
Equity in losses of affiliated companies, less dividends received 1— 18
Changes in assets and liabilities:
Accounts receivable (286) 300 181
Inventories 578 (174) (194)
Accounts payable 326 (250) 105
Restructuring charges, net of cash paid (14) 33 (82)
Taxes deferred and payable, net (112) (256) 10
Accrued pension (84) (123) (70)
Employee compensation 213 (84) (24)
Other 186 (145) (216)
Cash provided by continuing operating activities 1,550 327 927
Investing activities of continuing operations
Capital expenditures (541) (547) (536)
Proceeds from sale of assets 77 119 130
Proceeds from sale of Maytag adjacent businesses —— 100
Investment in related businesses (35) (5) (25)
Cash used in investing activities of continuing operations (499) (433) (331)
Financing activities of continuing operations
Proceeds from borrowings of long-term debt 872 545 3
Net (repayments) proceeds from short-term borrowings (362) 101 (243)
Repayments of long-term debt (210) (131) (17)
Dividends paid (128) (128) (134)
Common stock issued 21 21 68
Purchase of treasury stock —(247) (368)
Other (49) (20) (5)
Cash provided by (used in) financing activities of continuing operations 144 141 (696)
Cash provided by operating activities from discontinued operations —— 6
Effect of exchange rate changes on cash and equivalents 39 (90) 33
Increase (decrease) in cash and equivalents 1,234 (55) (61)
Cash and equivalents at beginning of year 146 201 262
Cash and equivalents at end of year $ 1,380 $ 146 $ 201
Supplemental disclosure of cash flow information
Cash paid for interest $ 209 $ 200 $ 204
Cash paid for taxes 51 76 39
99