Whirlpool 2009 Annual Report Download - page 108
Download and view the complete annual report
Please find page 108 of the 2009 Whirlpool annual report below. You can navigate through the pages in the report by either clicking on the pages listed below, or by using the keyword search tool below to find specific information within the annual report.-
 1
1 -
2
-
3
-
4
-
5
-
6
-
7
-
8
-
9
-
10
-
11
-
12
-
13
-
14
-
15
-
16
-
17
-
18
-
19
-
20
-
21
-
22
-
23
-
24
-
25
-
26
-
27
-
28
-
29
-
30
-
31
-
32
-
33
-
34
-
35
-
36
-
37
-
38
-
39
-
40
-
41
-
42
-
43
-
44
-
45
-
46
-
47
-
48
-
49
-
50
-
51
-
52
-
53
-
54
-
55
-
56
-
57
-
58
-
59
-
60
-
61
-
62
-
63
-
64
-
65
-
66
-
67
-
68
-
69
-
70
-
71
-
72
-
73
-
74
-
75
-
76
-
77
-
78
-
79
-
80
-
81
-
82
-
83
-
84
-
85
-
86
-
87
-
88
-
89
-
90
-
91
-
92
-
93
-
94
-
95
-
96
-
97
-
 98
98 -
 99
99 -
 100
100 -
 101
101 -
 102
102 -
 103
103 -
 104
104 -
 105
105 -
 106
106 -
 107
107 -
 108
108 -
 109
109 -
 110
110 -
 111
111 -
 112
112
 |
 |

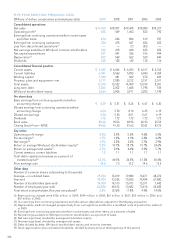
FI V E -Y E A R S E LEC T E D F I N A N C I A L DATA
(Millions of dollars, except share and employee data) 2009 2008 2007 2006 2005
Consolidated operations
Net sales $ 17,099 $ 18,907 $ 19,408 $ 18,080 $ 14,317
Operating profit(1) 688 549 1,063 823 792
Earnings from continuing operations before income taxes
and other items 294 246 804 619 597
Earnings from continuing operations 354 418 647 486 422
Loss from discontinued operations(2) —— (7) (53) —
Net earnings available to Whirlpool common stockholders 328 418 640 433 422
Net capital expenditures 541 547 536 576 494
Depreciation(3) 497 569 562 520 440
Dividends 128 128 134 130 116
Consolidated financial position
Current assets $ 7,025 $ 6,044 $ 6,555 $ 6,517 $ 4,763
Current liabilities 5,941 5,563 5,893 6,043 4,354
Working capital 1,084 481 662 474 409
Property, plant and equipment—net 3,117 2,985 3,212 3,157 2,511
Total assets 15,094 13,532 14,009 13,759 8,301
Long-term debt 2,502 2,002 1,668 1,798 745
Whirlpool stockholders’ equity 3,664 3,006 3,911 3,283 1,745
Per share data
Basic earnings from continuing operations before
accounting change $ 4.39 $ 5.57 $ 8.24 $ 6.47 $ 6.30
Diluted earnings from continuing operations before
accounting change 4.34 5.50 8.10 6.35 6.19
Diluted net earnings 4.34 5.50 8.01 5.67 6.19
Dividends 1.72 1.72 1.72 1.72 1.72
Book value 48.48 39.54 48.96 42.93 25.54
Closing Stock Price—NYSE 80.66 41.35 81.63 83.02 83.76
Key ratios
Operating profit margin 4.0% 2.9% 5.5% 4.6% 5.5%
Pre-tax margin(4) 1.7% 1.3% 4.1% 3.4% 4.2%
Net margin(5) 1.9% 2.2% 3.3% 2.7% 2.9%
Return on average Whirlpool stockholders’ equity(6) 9.8% 10.7% 18.1% 15.7% 24.6%
Return on average total assets(7) 2.3% 3.0% 4.6% 3.9% 5.1%
Current assets to current liabilities 1.2 1.1 1.1 1.1 1.1
Total debt—appliance business as a percent of
invested capital(8) 43.6% 46.0% 34.5% 41.2% 40.4%
Price earnings ratio 18.6 7.5 10.2 14.6 13.5
Other data
Number of common shares outstanding (in thousands):
Average—on a diluted basis 75,584 76,019 79,880 76,471 68,272
Year-end 74,704 73,536 75,835 78,484 67,880
Number of stockholders (year-end) 14,930 14,515 15,011 15,311 7,442
Number of employees (year-end) 66,884 69,612 73,682 73,416 65,682
Total return to shareholders (five year annualized)(9) 5.8% (8.5)% 11.8% 4.9% 14.5%
(1) Restructuring charges were $126 million in 2009, $149 million in 2008, $61 million in 2007, $55 million in 2006 and
$57 million in 2005.
(2) Our earnings from continuing operations exclude certain dispositions adjacent to the Maytag acquisition.
(3) Depreciation method changed prospectively from a straight-line method to a modified units of production method
in 2009.
(4) Earnings from continuing operations before income taxes and other items, as a percent of sales.
(5) Net earnings available to Whirlpool common stockholders, as a percent of sales.
(6) Net earnings (loss), divided by average stockholders’ equity.
(7) Net earnings (loss), divided by average total assets.
(8) Debt divided by debt, Whirlpool stockholders’ equity and minority interests.
(9) Stock appreciation plus reinvested dividends, divided by share price at the beginning of the period.
104