Whirlpool 2009 Annual Report Download - page 12
Download and view the complete annual report
Please find page 12 of the 2009 Whirlpool annual report below. You can navigate through the pages in the report by either clicking on the pages listed below, or by using the keyword search tool below to find specific information within the annual report.-
 1
1 -
 2
2 -
 3
3 -
 4
4 -
 5
5 -
 6
6 -
 7
7 -
 8
8 -
 9
9 -
 10
10 -
 11
11 -
 12
12 -
 13
13 -
 14
14 -
 15
15 -
 16
16 -
 17
17 -
 18
18 -
 19
19 -
 20
20 -
 21
21 -
 22
22 -
23
-
24
-
25
-
26
-
27
-
28
-
29
-
30
-
31
-
32
-
33
-
34
-
35
-
36
-
37
-
38
-
39
-
40
-
41
-
42
-
43
-
44
-
45
-
46
-
47
-
48
-
49
-
50
-
51
-
52
-
53
-
54
-
55
-
56
-
57
-
58
-
59
-
60
-
61
-
62
-
63
-
64
-
65
-
66
-
67
-
68
-
69
-
70
-
71
-
72
-
73
-
74
-
75
-
76
-
77
-
78
-
79
-
80
-
81
-
82
-
83
-
84
-
85
-
86
-
87
-
88
-
89
-
90
-
91
-
92
-
93
-
94
-
95
-
96
-
97
-
98
-
99
-
100
-
101
-
102
-
103
-
104
-
105
-
106
-
107
-
108
-
109
-
110
-
111
-
112
 |
 |

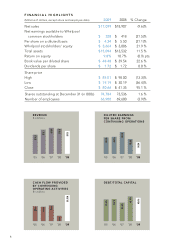
F I N A N C I A L H I G H L I G H T S
(Millions of dollars, except share and employee data) 2009 2008 % Change
Net sales $ 17,099 $ 18,907 (9.6)%
Net earnings available to Whirlpool
common stockholders $ 328 $ 418 (21.5)%
Per share on a diluted basis $ 4.34 $ 5.50 (21.1)%
Whirlpool stockholders’ equity $ 3,664 $ 3,006 21.9 %
Total assets $ 15,094 $ 13,532 11.5 %
Return on equity 9.8% 10.7% (0.9) pts.
Book value per diluted share $ 48.48 $ 39.54 22.6 %
Dividends per share $ 1.72 $ 1.72 0.0 %
Share price
High $ 85.01 $ 98.00 (13.3)%
Low $ 19.19 $ 30.19 (36.4)%
Close $ 80.66 $ 41.35 95.1 %
Shares outstanding at December 31 (in 000s) 74,704 73,536 1.6 %
Number of employees 66,900 69,600 (3.9)%
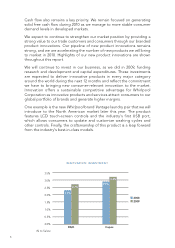
’05 ’06 ’07 ’08 ’09
$17.1
$18.9
$19.4
$18.1
$14.3
’05 ’06 ’07 ’08 ’09
$4.34
$5.50
$8.10
$6.35
$6.19
DILUTED E A R NINGS
PER SHARE F ROM
CONTINUIN G OPERATIONS
REVENUE
$ in billions
CASH FLOW P ROVIDED
BY CONTIN U I NG
OPERATING ACT I V ITIES
$ in millions
DEBT/TOTAL CA P I TA L
’05 ’06 ’07 ’08 ’09
$327
$927
$880
$884
’05 ’06 ’07 ’08 ’09
46.0%
34.5%
41.2%
40.4%
$1,550
43.6%
8