Whirlpool 2003 Annual Report Download - page 34
Download and view the complete annual report
Please find page 34 of the 2003 Whirlpool annual report below. You can navigate through the pages in the report by either clicking on the pages listed below, or by using the keyword search tool below to find specific information within the annual report.-
 1
1 -
2
-
3
-
4
-
5
-
6
-
7
-
8
-
9
-
10
-
11
-
12
-
13
-
14
-
15
-
16
-
17
-
18
-
19
-
20
-
21
-
22
-
23
-
 24
24 -
 25
25 -
 26
26 -
 27
27 -
 28
28 -
 29
29 -
 30
30 -
 31
31 -
 32
32 -
 33
33 -
 34
34 -
 35
35 -
 36
36 -
 37
37 -
 38
38 -
 39
39 -
 40
40
 |
 |

32
Eleven-Year Consolidated Statistical Review
(Millions of dollars except share and employee data) 2003 2002 2001
Consolidated operations
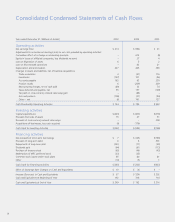
Net sales $12,176 $11,016 $10,343
Operating profit (1) 830 692 306
Earnings (loss) from continuing operations before income taxes and other items 652 495 93
Earnings (loss) from continuing operations 414 262 34
Earnings (loss) from discontinued operations (2) – (43) (21)
Net earnings (loss) (3) 414 (394) 21
Net capital expenditures 423 430 378
Depreciation 423 391 368
Dividends 94 91 113
Consolidated financial position
Current assets 3,865 3,327 3,311
Current liabilities 3,589 3,505 3,102
Working capital 276 (178) 209
Property, plant and equipment – net 2,456 2,338 2,052
Total assets 7,361 6,631 6,967
Long-term debt 1,134 1,092 1,295
Stockholders’ equity 1,301 739 1,458
Per share data
Basic earnings (loss) from continuing operations before accounting change 6.03 3.86 0.51
Diluted earnings (loss) from continuing operations before accounting change 5.91 3.78 0.50
Diluted net earnings (loss) (3) 5.91 (5.68) 0.31
Dividends 1.36 1.36 1.36
Book value 18.56 10.67 21.44
Closing Stock Price – NYSE 72.65 52.22 73.33
Key ratios(4)
Operating profit margin 6.8% 6.3% 3.0%
Pre-tax margin (5) 5.4% 4.5% 0.9%
Net margin (6) 3.4% 2.4% 0.3%
Return on average stockholders’ equity (7) 42.9% 14.8% 1.3%
Return on average total assets (8) 6.1% 3.4% 0.4%
Current assets to current liabilities 1.1 x 0.9 x 1.1 x
Total debt – appliance business as a percent of invested capital (9) 50.9% 65.1% 48.0%
Price earnings ratio 12.3 x (9.2)x 236.5 x
Interest coverage (10) 5.8 x 4.5 x 1.6 x
Other data
Number of common shares outstanding (in thousands):
Average – on a diluted basis 70,082 69,267 68,036
Year-end 68,931 68,226 67,215
Number of stockholders (year-end) 8,178 8,556 8,840
Number of employees (year-end) 68,407 68,272 61,923
Total return to stockholders (five-year annualized) (11) 8.1% 1.4% 12.2%
1 Restructuring and special operating charges were $14 million in 2003, $161 million in 2002, $212 million in 2001, $405 million in 1997, $30 million in 1996 and $250 million in 1994.
2 The company’s financial services business was discontinued in 1997.
3 Includes cumulative effect of accounting changes: 2002 – Accounting for goodwill of ($613) million or ($8.84) per diluted share; 2001 – Accounting for derivative instruments and hedging activities of
$8 million or $0.12 per diluted share; 1993 – Accounting for postretirement benefits other than pensions of ($180) million or ($2.42) per diluted share.
4 Excluding one-time charges for restructuring and related charges, a minority investment write-off in a European business, goodwill write-off of an Asian entity, product recalls, discontinued operations
and accounting changes in 2002, selected key ratios would be as follows: a) Operating profit margin – 7.9%, b) Pre-tax margin – 6.1%, c) Net margin – 3.8%, d) Return on average stockholders’
equity – 27%, e) Return on average total assets – 6.1%, and f) Interest coverage – 6x. Excluding one-time charges for restructuring and related charges, product recalls, discontinued operations and
accounting changes in 2001, selected key ratios would be as follows: a) Operating profit margin – 7.9%, b) Pre-tax margin – 5.8%, c) Net margin – 3.6%, d) Return on average stockholders’ equity –
22%, e) Return on average total assets – 5.6%, and f) Interest coverage – 5x. Excluding the first quarter impact of the Brazilian currency devaluation in 1999 and the gain from discontinued operations