Whirlpool 2003 Annual Report Download - page 25
Download and view the complete annual report
Please find page 25 of the 2003 Whirlpool annual report below. You can navigate through the pages in the report by either clicking on the pages listed below, or by using the keyword search tool below to find specific information within the annual report.-
 1
1 -
2
-
3
-
4
-
5
-
6
-
7
-
8
-
9
-
10
-
11
-
12
-
13
-
14
-
 15
15 -
 16
16 -
 17
17 -
 18
18 -
 19
19 -
 20
20 -
 21
21 -
 22
22 -
 23
23 -
 24
24 -
 25
25 -
 26
26 -
 27
27 -
 28
28 -
 29
29 -
 30
30 -
 31
31 -
 32
32 -
 33
33 -
 34
34 -
 35
35 -
36
-
37
-
38
-
39
-
40
 |
 |

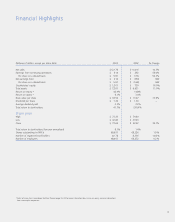
Financial Summary
23
The following is a summary of the Company's financial condition and results of operations for 2003. For a more
complete understanding of the Company’s financial condition and results, this summary should be read together
with the Company’s Consolidated Financial Statements and related notes, and the “Management’s Discussion and
Analysis.” This information appears in the Financial Supplement to the Company’s Proxy Statement and in the
Financial Supplement to the 2003 Annual Report on Form 10-K, both of which are available through the Internet
at www.whirlpoolcorp.com.
Executive level overview
Whirlpool Corporation is the largest global manufacturer of major appliances worldwide with 2003 revenues of $12.2 billion
and net earnings of $414 million. The Company’s four reportable segments are based on geography and consist of North
America (64% of revenue), Europe (22% of revenue), Latin America (11% of revenue) and Asia (3% of revenue). The
Company is the market share leader in North America and Latin America and has significant market presence in Europe, India
and China.
The Company’s growth strategy over the past several years has been to introduce innovative new products, continue to
expand its global footprint, add or enhance distribution channels and evaluate potential acquisitions that enhance the
Company’s innovative global product offering.
The Company monitors country economic factors such as gross domestic product, consumer interest rates, consumer
confidence, housing starts, existing home sales and mortgage refinancing as key indicators of industry demand. Management
also focuses on country, brand, product and channel market share, average sales values and profitability when assessing and
forecasting financial results. The Company also focuses on total cost productivity, which includes material and
conversion costs, as it continues to reduce its total global costs to operate the business and fund future growth.
Overall results of operations
Net Sales
The total number of units sold in 2003 increased 5.6% over 2002. Consolidated net sales increased 10.5% over 2002, which
includes a positive impact from currency fluctuations. Excluding currency impact, net sales increased approximately 7%.
Excluding currency fluctuations and the acquisitions of Vitromatic (Whirlpool Mexico) and Polar, the total number of units
and dollars sold increased approximately 4% and 5%, respectively.
Significant regional trends were as follows:
■In 2003, North American unit volumes increased 7.5% versus 2002. Volume increases were driven by the full-year acquisition
impact of Whirlpool Mexico, strong performance in Canada and volume gains in Whirlpool and KitchenAid brands, partially
offset by weaker shipments of products manufactured under the Kenmore brand for Sears, Roebuck & Co.
■European unit volumes increased 5.1% versus 2002. Net sales increased 22.4% due primarily to positive currency impact.
Excluding currency impact and the Polar acquisition, net sales increased approximately 3%, lagging unit growth due to
marketplace pricing pressures. The region experienced improvement in industry volumes as overall economic indicators and
consumer confidence edged up in several key markets within the region.
■Appliance unit volumes in Latin America declined 2.7% versus 2002, due primarily to the weak economic environment in
the region. The region’s sales increased 6.7% when compared to 2002, mainly the result of price increases necessitated by
higher material costs.
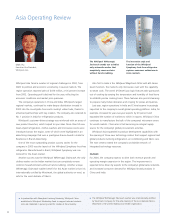
■Asia’s unit volumes increased 2.9% over 2002, while net sales increased by 6.6%. The region experienced a number of
challenges, which negatively impacted its performance, including significant pricing pressures in China and India.
Gross Margin
The consolidated gross margin percentage in 2003 decreased 60 basis points versus 2002 due primarily to higher U.S.
pension and medical expenses coupled with reduced Befiex credits, an increase in expense due to the decline of the U.S. dollar
and higher material costs in Latin America. The higher expense was partially offset by productivity improvements in North
America and Europe and lower restructuring and related expenses.