Whirlpool 2003 Annual Report Download - page 15
Download and view the complete annual report
Please find page 15 of the 2003 Whirlpool annual report below. You can navigate through the pages in the report by either clicking on the pages listed below, or by using the keyword search tool below to find specific information within the annual report.-
 1
1 -
2
-
3
-
4
-
 5
5 -
 6
6 -
 7
7 -
 8
8 -
 9
9 -
 10
10 -
 11
11 -
 12
12 -
 13
13 -
 14
14 -
 15
15 -
 16
16 -
 17
17 -
 18
18 -
 19
19 -
 20
20 -
 21
21 -
 22
22 -
 23
23 -
 24
24 -
 25
25 -
26
-
27
-
28
-
29
-
30
-
31
-
32
-
33
-
34
-
35
-
36
-
37
-
38
-
39
-
40
 |
 |

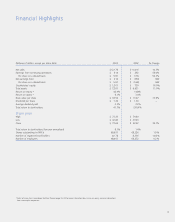
Financial Highlights
(Millions of dollars, except per share data) 2003 2002 % Change
Net sales $12,176 $ 11,016 10.5%
Earnings from continuing operations $ 414 $ 262 58.0%
Per share on a diluted basis $ 5.91 $ 3.78 56.3%
Net earnings (loss) $ 414 $ (394) NM1
Per share on a diluted basis $ 5.91 $ (5.68) NM1
Stockholders' equity $ 1,301 $ 739 76.0%
Total assets $ 7,361 $ 6,631 11.0%
Return on equity * 42.9% 14.8%
Return on assets * 6.1% 3.4%
Book value per share $ 18.56 $ 10.67 73.9%
Dividends per share $ 1.36 $ 1.36 –
Average dividend yield 2.2% 2.2%
Total return to stockholders 41.7% (26.9)%
Share price
High $ 73.35 $ 79.80
Low $ 42.80 $ 39.23
Close $ 72.65 $ 52.22 39.1%
Total return to stockholders (five-year annualized) 8.1% 1.4%
Shares outstanding (in 000's) 68,931 68,226 1.0 %
Number of registered stockholders 8,178 8,556 (4.4)%
Number of employees 68,407 68,272 0.2 %
* Refer to Eleven-Year Consolidated Statistical Review (pages 32-33) for more information about return on equity and asset calculations.
1 Not a meaningful comparison.
13