Vistaprint 2012 Annual Report Download - page 2
Download and view the complete annual report
Please find page 2 of the 2012 Vistaprint annual report below. You can navigate through the pages in the report by either clicking on the pages listed below, or by using the keyword search tool below to find specific information within the annual report.-
 1
1 -
 2
2 -
 3
3 -
 4
4 -
 5
5 -
 6
6 -
 7
7 -
 8
8 -
 9
9 -
 10
10 -
 11
11 -
 12
12 -
 13
13 -
 14
14 -
 15
15 -
 16
16 -
 17
17 -
 18
18 -
 19
19 -
 20
20 -
 21
21 -
 22
22 -
 23
23 -
 24
24 -
 25
25 -
 26
26 -
 27
27 -
 28
28 -
 29
29 -
 30
30 -
 31
31 -
 32
32 -
 33
33 -
 34
34 -
 35
35 -
 36
36 -
 37
37 -
 38
38 -
 39
39 -
 40
40 -
 41
41 -
 42
42 -
 43
43 -
 44
44 -
 45
45 -
 46
46 -
 47
47 -
 48
48 -
 49
49 -
 50
50 -
 51
51 -
 52
52 -
 53
53 -
 54
54 -
 55
55 -
 56
56 -
 57
57 -
 58
58 -
 59
59 -
 60
60 -
 61
61 -
 62
62 -
 63
63 -
 64
64 -
 65
65 -
 66
66 -
 67
67 -
 68
68 -
 69
69 -
 70
70 -
 71
71 -
 72
72 -
 73
73 -
 74
74 -
 75
75 -
 76
76 -
 77
77 -
 78
78 -
 79
79 -
 80
80 -
 81
81 -
 82
82 -
 83
83 -
 84
84 -
 85
85 -
 86
86 -
 87
87 -
 88
88 -
 89
89 -
 90
90 -
 91
91 -
 92
92 -
 93
93 -
 94
94 -
 95
95 -
 96
96 -
 97
97 -
 98
98 -
 99
99 -
 100
100 -
 101
101 -
 102
102 -
 103
103 -
 104
104 -
 105
105 -
 106
106 -
 107
107 -
 108
108 -
 109
109 -
 110
110 -
 111
111 -
 112
112 -
 113
113 -
 114
114 -
 115
115 -
 116
116 -
 117
117 -
 118
118 -
 119
119 -
 120
120 -
 121
121 -
 122
122 -
 123
123 -
 124
124 -
 125
125 -
 126
126 -
 127
127 -
 128
128 -
 129
129 -
 130
130 -
 131
131 -
 132
132 -
 133
133 -
 134
134 -
 135
135 -
 136
136 -
 137
137 -
 138
138 -
 139
139 -
 140
140 -
 141
141 -
 142
142 -
 143
143 -
 144
144 -
 145
145 -
 146
146 -
 147
147 -
 148
148
 |
 |

$700
$500
$600
$400
$300
$200
$100
$0
$800
$900
$1,000
$152.1
FY 2006
$255.9
FY 2007
$400.7
FY 2008
$515.8
FY 2009
$670.0
FY 2010
$817.0
FY 2011 FY 2012
$1,020.3
$1.50
$1.25
$1.00
$0.75
$0.50
$0.25
$0.00
$1.75
$2.00
$0.45
$0.60
$0.87
$1.25
$1.49
$1.83
FY 2006 FY 2007 FY 2008 FY 2009 FY 2010 FY 2011 FY 2012
$1.13
10
5
6
7
8
9
4
3
2
1
0
11
12
13
14
2.7
FY 2006
4.1
FY 2007
6.2
FY 2008
8.0
FY 2009
9.6
FY 2010
11.4
FY 2011
14.4
FY 2012
$80
$70
$50
$60
$40
$30
$20
$10
$0
$53
FY 2006
$58
FY 2007
$61
FY 2008
$63
FY 2009
$70
FY 2010
$72
FY 2011
$68
FY 2012
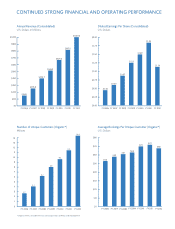
CONTINUED STRONG FINANCIAL AND OPERATING PERFORMANCE
Annual Revenue (Consolidated)
U.S. Dollars in Millions
Number of Unique Customers (Organic*)
Millions
Diluted Earnings Per Share (Consolidated)
U.S. Dollars
Average Bookings Per Unique Customer (Organic*)
U.S. Dollars
*Organic metrics exclude the fiscal 2012 acquisitions of Webs and Albumprinter
