United Healthcare 2003 Annual Report Download - page 30
Download and view the complete annual report
Please find page 30 of the 2003 United Healthcare annual report below. You can navigate through the pages in the report by either clicking on the pages listed below, or by using the keyword search tool below to find specific information within the annual report.-
 1
1 -
2
-
3
-
4
-
5
-
6
-
7
-
8
-
9
-
10
-
11
-
12
-
13
-
14
-
15
-
16
-
17
-
18
-
19
-
 20
20 -
 21
21 -
 22
22 -
 23
23 -
 24
24 -
 25
25 -
 26
26 -
 27
27 -
 28
28 -
 29
29 -
 30
30 -
 31
31 -
 32
32 -
 33
33 -
 34
34 -
 35
35 -
 36
36 -
 37
37 -
 38
38 -
 39
39 -
 40
40 -
41
-
42
-
43
-
44
-
45
-
46
-
47
-
48
-
49
-
50
-
51
-
52
-
53
-
54
-
55
-
56
-
57
-
58
-
59
-
60
-
61
-
62
-
63
-
64
-
65
-
66
-
67
-
68
-
69
-
70
-
71
-
72
 |
 |

28 UnitedHealth Group
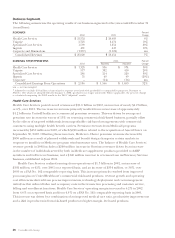
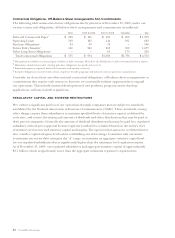
Business Segments
The following summarizes the operating results of our business segments for the years ended December 31
(in millions):
REVENUES
Percent
2002 2001 Change
Health Care Services $21,552 $20,403 6%
Uniprise 2,725 2,474 10%
Specialized Care Services 1,509 1,254 20%
Ingenix 491 447 10%
Corporate and Eliminations (1,257) (1,124) nm
Consolidated Revenues $25,020 $23,454 7%
EARNINGS FROM OPERATIONS
2001 Percent
2002 Reported Adjusted1Change1
Health Care Services $1,328 $936 $974 36%
Uniprise 517 382 410 26%
Specialized Care Services 286 214 220 30%
Ingenix 55 48 69 (20%)
Corporate – (14) (14) nm
Consolidated Earnings From Operations
$
2,186
$
1,566
$
1,659 32%
nm — not meaningful
1Adjusted to exclude $93 million of amortization expense associated with goodwill for comparability purposes. Pursuant to
FAS No. 142, which we adopted effective January 1, 2002, goodwill is no longer amortized. Where applicable, the percent change
is calculated comparing the 2002 results to the 2001 “Adjusted” results.
Health Care Services
Health Care Services posted record revenues of $21.6 billion in 2002, an increase of nearly $1.2 billion,
or 6%, over 2001. The increase in revenues primarily resulted from an increase of approximately
$1.2 billion in UnitedHealthcare’s commercial premium revenues. This was driven by average net
premium rate increases in excess of 13% on renewing commercial risk-based business, partially offset
by the effects of targeted withdrawals from unprofitable risk-based arrangements with commercial
customers using multiple health benefit carriers. Premium revenues from Medicaid programs
increased by $450 million in 2002, of which $240 million related to the acquisition of AmeriChoice on
September 30, 2002. Offsetting these increases, Medicare+Choice premium revenues decreased by
$850 million as a result of planned withdrawals and benefit design changes in certain markets in
response to insufficient Medicare program reimbursement rates. The balance of Health Care Services’
revenue growth in 2002 includes a $240 million increase in Ovations revenues driven by an increase
in the number of individuals served by both its Medicare supplement products provided to AARP
members and its Evercare business, and a $140 million increase in revenues from its Pharmacy Services
business, established in June 2001.
Health Care Services realized earnings from operations of $1.3 billion in 2002, an increase of
$392 million, or 42%, over 2001 on a reported basis, and an increase of $354 million, or 36%, over
2001 on a FAS No. 142 comparable reporting basis. This increase primarily resulted from improved
gross margins on UnitedHealthcare’s commercial risk-based products, revenue growth and operating
cost efficiencies derived from process improvements, technology deployment and cost management
initiatives that reduced labor and occupancy costs in the transaction processing and customer service,
billing and enrollment functions. Health Care Services’ operating margin increased to 6.2% in 2002
from 4.6% on a reported basis and from 4.8% on a FAS No. 142 comparable reporting basis in 2001.
This increase was driven by a combination of an improved medical care ratio, productivity improvements
and a shift in product mix from risk-based products to higher-margin, fee-based products.