United Healthcare 2003 Annual Report Download - page 29
Download and view the complete annual report
Please find page 29 of the 2003 United Healthcare annual report below. You can navigate through the pages in the report by either clicking on the pages listed below, or by using the keyword search tool below to find specific information within the annual report.-
 1
1 -
2
-
3
-
4
-
5
-
6
-
7
-
8
-
9
-
10
-
11
-
12
-
13
-
14
-
15
-
16
-
17
-
18
-
 19
19 -
 20
20 -
 21
21 -
 22
22 -
 23
23 -
 24
24 -
 25
25 -
 26
26 -
 27
27 -
 28
28 -
 29
29 -
 30
30 -
 31
31 -
 32
32 -
 33
33 -
 34
34 -
 35
35 -
 36
36 -
 37
37 -
 38
38 -
 39
39 -
40
-
41
-
42
-
43
-
44
-
45
-
46
-
47
-
48
-
49
-
50
-
51
-
52
-
53
-
54
-
55
-
56
-
57
-
58
-
59
-
60
-
61
-
62
-
63
-
64
-
65
-
66
-
67
-
68
-
69
-
70
-
71
-
72
 |
 |

UnitedHealth Group 27
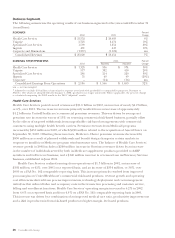
Medical Costs
The consolidated medical care ratio decreased from 85.3% in 2001 to 83.0% in 2002. Excluding the
AARP business, the medical care ratio decreased by 250 basis points from 83.9% in 2001 to 81.4% in
2002. Approximately 90 basis points of the medical care ratio decrease resulted from targeted
withdrawals from unprofitable risk-based arrangements with commercial customers using multiple
health benefit carriers and a shift in commercial customer mix, with a larger percentage of premium
revenues derived from small business customers. These employer groups typically have a lower medical
care ratio, but carry higher operating costs than larger customers. Additionally, the medical care ratio
decreased approximately 90 basis points because of withdrawals and benefit design changes in certain
Medicare markets pertaining to our Medicare+Choice offering. The balance of the decrease in the
medical care ratio was primarily driven by changes in product and business mix, care management
activities and net premium rate increases that exceeded overall medical benefit cost increases.
On an absolute dollar basis, consolidated medical costs increased by $548 million, or 3%, over 2001.
This increase principally resulted from a rise in medical costs of approximately 12%, or $2.1 billion,
driven by the combination of medical cost inflation and increased health care consumption. Partially
offsetting this increase, medical costs decreased by approximately $1.4 billion due to net reductions
in the number of people receiving benefits under our Medicare and commercial risk-based products.
The balance of the decrease in medical costs was driven primarily by changes in benefit designs in
certain Medicare markets.
Operating Costs
The operating cost ratio was 17.5% in 2002, compared with 17.0% in 2001. During 2002, our fee-based
products and services grew at a faster rate than our premium-based products, and fee-based products
have much higher operating cost ratios than premium-based products. In addition, our Medicare
business, which has relatively low operating costs as a percentage of revenues, decreased in size relative
to our overall operations. Using a revenue mix comparable to 2001, the 2002 operating cost ratio would
have decreased slightly in 2002. This decrease was principally driven by operating cost efficiencies
derived from process improvements, technology deployment and cost management initiatives that
reduced labor and occupancy costs in our transaction processing and customer service, billing and
enrollment functions. The impact of these efficiencies was partially offset by the incremental costs
associated with the development, deployment, adoption and maintenance of new technology releases,
as well as increased business self-insurance costs during 2002.
On an absolute dollar basis, operating costs increased by $408 million, or 10%, over 2001. This
increase was driven by a 7% increase in the total number of individuals served by Health Care Services
and Uniprise during 2002, general operating cost inflation and the additional costs associated with
acquired businesses.
Depreciation and Amortization
Depreciation and amortization was $255 million in 2002 and $265 million in 2001. This decrease
was due to $93 million of amortization expense in 2001 recorded for goodwill, which was no longer
amortized in 2002 pursuant to the adoption of Financial Accounting Standards (FAS) No. 142,
“Goodwill and Other Intangible Assets.” This decrease was largely offset by $83 million of additional
depreciation and amortization resulting from higher levels of equipment and capitalized software
as a result of technology enhancements and business growth.
Income Taxes
Our effective income tax rate was 35.5% in 2002 and 38.0% in 2001. The decrease was primarily due
to the impact of non-tax-deductible goodwill amortization that is no longer amortized for financial
reporting purposes, as required by FAS No. 142. Assuming FAS No. 142 was effective during 2001,
the effective tax rate would have been approximately 36.0% during 2001.