Ulta 2014 Annual Report Download - page 44
Download and view the complete annual report
Please find page 44 of the 2014 Ulta annual report below. You can navigate through the pages in the report by either clicking on the pages listed below, or by using the keyword search tool below to find specific information within the annual report.
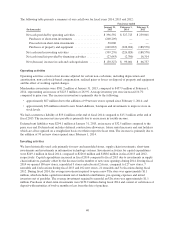
The following table presents a summary of our cash flows for fiscal years 2014, 2013 and 2012:
Fiscal year ended
(In thousands)
January 31,
2015
February 1,
2014
February 2,
2013
Net cash provided by operating activities ................ $396,592 $ 327,725 $ 239,001
Purchases of short-term investments .................. (200,209) — —
Proceeds from short-term investments ................. 50,000 — —
Purchases of property and equipment ................. (249,067) (226,024) (188,578)
Net cash used in investing activities .................... (399,276) (226,024) (188,578)
Net cash (used in) provided by financing activities ......... (27,643) (2,700) 16,314
Net (decrease) increase in cash and cash equivalents ....... $ (30,327) $ 99,001 $ 66,737
Operating activities
Operating activities consist of net income adjusted for certain non-cash items, including depreciation and
amortization, non-cash stock-based compensation, realized gains or losses on disposal of property and equipment
and the effect of working capital changes.
Merchandise inventories were $581.2 million at January 31, 2015, compared to $457.9 million at February 1,
2014, representing an increase of $123.3 million or 26.9%. Average inventory per store increased 10.7%
compared to prior year. The increase in inventory is primarily due to the following:
‰approximately $67 million due to the addition of 99 net new stores opened since February 1, 2014; and
‰approximately $56 million related to new brand additions, boutiques and investments to improve store in-
stock levels.
We had a current tax liability of $19.4 million at the end of fiscal 2014 compared to $15.3 million at the end of
fiscal 2013. The increase in taxes payable is primarily due to an increase in taxable income.
Deferred rent liabilities were $294.1 million at January 31, 2015, an increase of $32.5 million compared to the
prior year end. Deferred rent includes deferred construction allowances, future rental increases and rent holidays
which are all recognized on a straight-line basis over their respective lease term. The increase is primarily due to
the addition of 99 net new stores opened since February 1, 2014.
Investing activities
We have historically used cash primarily for new and remodeled stores, supply chain investments, short-term
investments and investments in information technology systems. Investment activities for capital expenditures
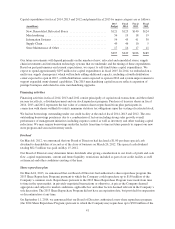
were $249.1 million in fiscal 2014, compared to $226.0 million and $188.6 million in fiscal 2013 and 2012,
respectively. Capital expenditures increased in fiscal 2014 compared to fiscal 2013 due to investments in supply
chain initiatives, partially offset by the decrease in the number of new store openings during 2014. During fiscal
2014 we opened 100 new stores, remodeled 9 stores and relocated 2 stores, compared to 127 new stores, 7
remodels and 4 relocations during fiscal 2013 and 102 new stores, 21 remodels and 3 relocations during fiscal
2012. During fiscal 2014, the average investment required to open a new Ulta store was approximately $1.1
million, which includes capital investment net of landlord contributions, pre-opening expenses and initial
inventory net of payables. The average investment required to remodel an Ulta store was approximately $1.1
million. Purchases of short-term investments were $150.2 million during fiscal 2014 and consist of certificates of
deposit with maturities of twelve months or less from the date of purchase.
40


