Ulta 2014 Annual Report Download - page 40
Download and view the complete annual report
Please find page 40 of the 2014 Ulta annual report below. You can navigate through the pages in the report by either clicking on the pages listed below, or by using the keyword search tool below to find specific information within the annual report.-
 1
1 -
2
-
3
-
4
-
5
-
6
-
7
-
8
-
9
-
10
-
11
-
12
-
13
-
14
-
15
-
16
-
17
-
18
-
19
-
20
-
21
-
22
-
23
-
24
-
25
-
26
-
27
-
28
-
29
-
 30
30 -
 31
31 -
 32
32 -
 33
33 -
 34
34 -
 35
35 -
 36
36 -
 37
37 -
 38
38 -
 39
39 -
 40
40 -
 41
41 -
 42
42 -
 43
43 -
 44
44 -
 45
45 -
 46
46 -
 47
47 -
 48
48 -
 49
49 -
 50
50 -
51
-
52
-
53
-
54
-
55
-
56
-
57
-
58
-
59
-
60
-
61
-
62
-
63
-
64
-
65
-
66
-
67
-
68
-
69
-
70
-
71
-
72
-
73
-
74
-
75
-
76
-
77
-
78
-
79
-
80
-
81
-
82
 |
 |

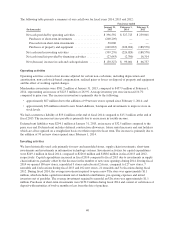
‰depreciation and amortization for all assets except those related to our retail and warehouse operations,
which is included in cost of sales; and
‰legal, finance, information systems and other corporate overhead costs.
This presentation of items in selling, general and administrative expenses may not be comparable to the way in
which our competitors or other retailers compute their selling, general and administrative expenses.
Pre-opening expense includes non-capital expenditures during the period prior to store opening for new,
remodeled and relocated stores including rent during the construction period for new and relocated stores, store
set-up labor, management and employee training and grand opening advertising.
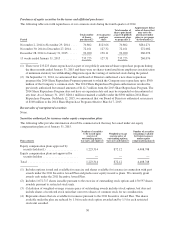
Interest expense includes interest costs and unused facility fees associated with our credit facility, which is
structured as an asset-based lending instrument. Our credit facility interest is based on a variable interest rate
structure which can result in increased cost in periods of rising interest rates. Interest income represents interest
from short-term investments with maturities of twelve months or less from the date of purchase.
Income tax expense reflects the federal statutory tax rate and the weighted average state statutory tax rate for the
states in which we operate stores.
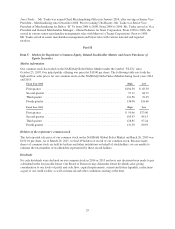
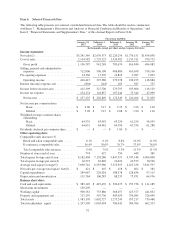
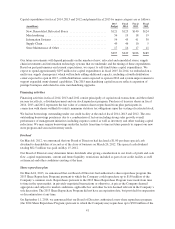
Results of operations
Our fiscal years are the 52 or 53 week periods ending on the Saturday closest to January 31. The Company’s
fiscal years ended January 31, 2015, February 1, 2014 and February 2, 2013 were 52, 52 and 53 week years,
respectively, and are hereafter referred to as fiscal 2014, fiscal 2013 and fiscal 2012.
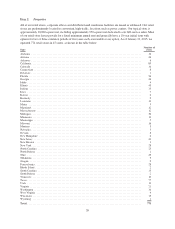
As of January 31, 2015, we operated 774 stores across 47 states. The following tables present the components of
our consolidated results of operations for the periods indicated:
Fiscal year ended
(Dollars in thousands)
January 31,
2015
February 1,
2014
February 2,
2013
Net sales ....................................... $3,241,369 $2,670,573 $2,220,256
Cost of sales .................................... 2,104,582 1,729,325 1,436,582
Gross profit ................................... 1,136,787 941,248 783,674
Selling, general and administrative expenses ........... 712,006 596,390 488,880
Pre-opening expenses ............................. 14,366 17,270 14,816
Operating income .............................. 410,415 327,588 279,978
Interest (income) expense, net ....................... (894) (118) 185
Income before income taxes ...................... 411,309 327,706 279,793
Income tax expense ............................... 154,174 124,857 107,244
Net income ................................... $ 257,135 $ 202,849 $ 172,549
Other operating data:
Number of stores end of period ...................... 774 675 550
Comparable sales increase:
Retail and salon comparable sales .................. 8.1% 6.1% 8.8%
E-commerce comparable sales .................... 56.4% 76.6% 30.7%
Total comparable sales increase ................... 9.9% 7.9% 9.3%
36