Ubisoft 2014 Annual Report Download - page 10
Download and view the complete annual report
Please find page 10 of the 2014 Ubisoft annual report below. You can navigate through the pages in the report by either clicking on the pages listed below, or by using the keyword search tool below to find specific information within the annual report.-
 1
1 -
 2
2 -
 3
3 -
 4
4 -
 5
5 -
 6
6 -
 7
7 -
 8
8 -
 9
9 -
 10
10 -
 11
11 -
 12
12 -
 13
13 -
 14
14 -
 15
15 -
 16
16 -
 17
17 -
 18
18 -
 19
19 -
 20
20 -
 21
21 -
22
-
23
-
24
-
25
-
26
-
27
-
28
-
29
-
30
-
31
-
32
-
33
-
34
-
35
-
36
-
37
-
38
-
39
-
40
-
41
-
42
-
43
-
44
-
45
-
46
-
47
-
48
-
49
-
50
-
51
-
52
-
53
-
54
-
55
-
56
-
57
-
58
-
59
-
60
-
61
-
62
-
63
-
64
-
65
-
66
-
67
-
68
-
69
-
70
-
71
-
72
-
73
-
74
-
75
-
76
-
77
-
78
-
79
-
80
-
81
-
82
-
83
-
84
-
85
-
86
-
87
-
88
-
89
-
90
-
91
-
92
-
93
-
94
-
95
-
96
-
97
-
98
-
99
-
100
-
101
-
102
-
103
-
104
-
105
-
106
-
107
-
108
-
109
-
110
-
111
-
112
-
113
-
114
-
115
-
116
-
117
-
118
-
119
-
120
-
121
-
122
-
123
-
124
-
125
-
126
-
127
-
128
-
129
-
130
-
131
-
132
-
133
-
134
-
135
-
136
-
137
-
138
-
139
-
140
-
141
-
142
-
143
-
144
-
145
-
146
-
147
-
148
-
149
-
150
-
151
-
152
-
153
-
154
-
155
-
156
-
157
-
158
-
159
-
160
-
161
-
162
-
163
-
164
-
165
-
166
-
167
-
168
-
169
-
170
-
171
-
172
-
173
-
174
-
175
-
176
-
177
-
178
-
179
-
180
-
181
-
182
-
183
-
184
-
185
-
186
-
187
-
188
-
189
-
190
-
191
-
192
-
193
-
194
-
195
-
196
-
197
-
198
-
199
-
200
-
201
-
202
-
203
-
204
-
205
-
206
-
207
-
208
-
209
-
210
-
211
-
212
-
213
-
214
-
215
-
216
-
217
-
218
-
219
-
220
-
221
-
222
-
223
-
224
-
225
-
226
-
227
-
228
-
229
-
230
-
231
-
232
-
233
-
234
-
235
-
236
-
237
-
238
-
239
-
240
-
241
-
242
-
243
 |
 |

Management Report
2014
5
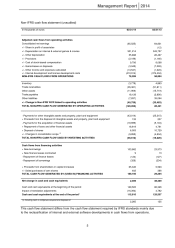
Non-IFRS cash flow statement (unaudited)
In thousands of euros
03/31/14
03/31/13
Adjusted cash flows from operating activities
Consolidated net earnings
(65,525)
64,831
+/- Share in profit of associates
-
(12)
+/- Depreciation on internal & external games & movies
351,214
343,757
+/- Other depreciation
55,898
26,497
+/- Provisions
(2,196)
(1,146)
+/- Cost of stock-based compensation
9,706
8,098
+/- Gains/losses on disposals
(3,945)
(7,093)
+/- Other income and expenses calculated
(13,537)
(1,645)
+/- Internal development and license development costs
(410,914)
(374,404)
NON-IFRS CASH FLOWS FROM OPERATIONS
79,299
58,884
Inventory
(3,778)
4,863
Trade receivables
(35,361)
(51,811)
Other assets
(11,909)
(15,719)
Trade payables
18,128
(2,890)
Other liabilities
(7,837)
35,094
+/- Change in Non-IFRS WCR linked to operating activities
(40,756)
(30,463)
TOTAL NON-IFRS CASH FLOW GENERATED BY OPERATING ACTIVITIES
(120,055)
28,421
- Payments for other intangible assets and property, plant and equipment
(43,014)
(25,215)
+ Proceeds from the disposal of intangible assets and property, plant and equipment
133
207
- Payments for the acquisition of financial assets
(18,699)
(5,104)
+ Repayment of loans and other financial assets
18,819
4,761
+ Disposal of shares
6,003
10,729
+/- Changes in consolidation scope
(1)
(9,855)
(4,604)
TOTAL NON-IFRS CASH FLOW USED BY INVESTING ACTIVITIES
(46,612)
(19,226)
Cash flows from financing activities
+ New borrowings
103,862
23,573
+ New finance leases contracted
9
13
- Repayment of finance leases
(124)
(127)
- Repayment of borrowings
(328)
(234)
+ Proceeds from shareholders in capital increases
65,345
5,593
+/- Sales/purchases of own shares
402
386
TOTAL CASH FLOW GENERATED BY (USED IN) FINANCING ACTIVITIES
169,166
29,204
Net change in cash and cash equivalents
2,499
38,399
Cash and cash equivalents at the beginning of the period
129,505
86,326
Impact of translation adjustments
(16,394)
4,782
Cash and cash equivalents at the end of the period*
115,610
129,507
(1) Including cash in companies acquired and disposed of
2,265
125
This cash flow statement differs from the cash flow statement required by IFRS standards mainly due
to the reclassification of internal and external software developments in cash flows from operations.