Suzuki 2005 Annual Report Download - page 5
Download and view the complete annual report
Please find page 5 of the 2005 Suzuki annual report below. You can navigate through the pages in the report by either clicking on the pages listed below, or by using the keyword search tool below to find specific information within the annual report.-
 1
1 -
 2
2 -
 3
3 -
 4
4 -
 5
5 -
 6
6 -
 7
7 -
 8
8 -
 9
9 -
 10
10 -
 11
11 -
 12
12 -
 13
13 -
 14
14 -
 15
15 -
 16
16 -
17
-
18
-
19
-
20
-
21
-
22
-
23
-
24
-
25
-
26
-
27
-
28
-
29
-
30
-
31
-
32
-
33
-
34
-
35
-
36
-
37
-
38
-
39
-
40
-
41
-
42
-
43
-
44
-
45
-
46
-
47
-
48
-
49
-
50
 |
 |
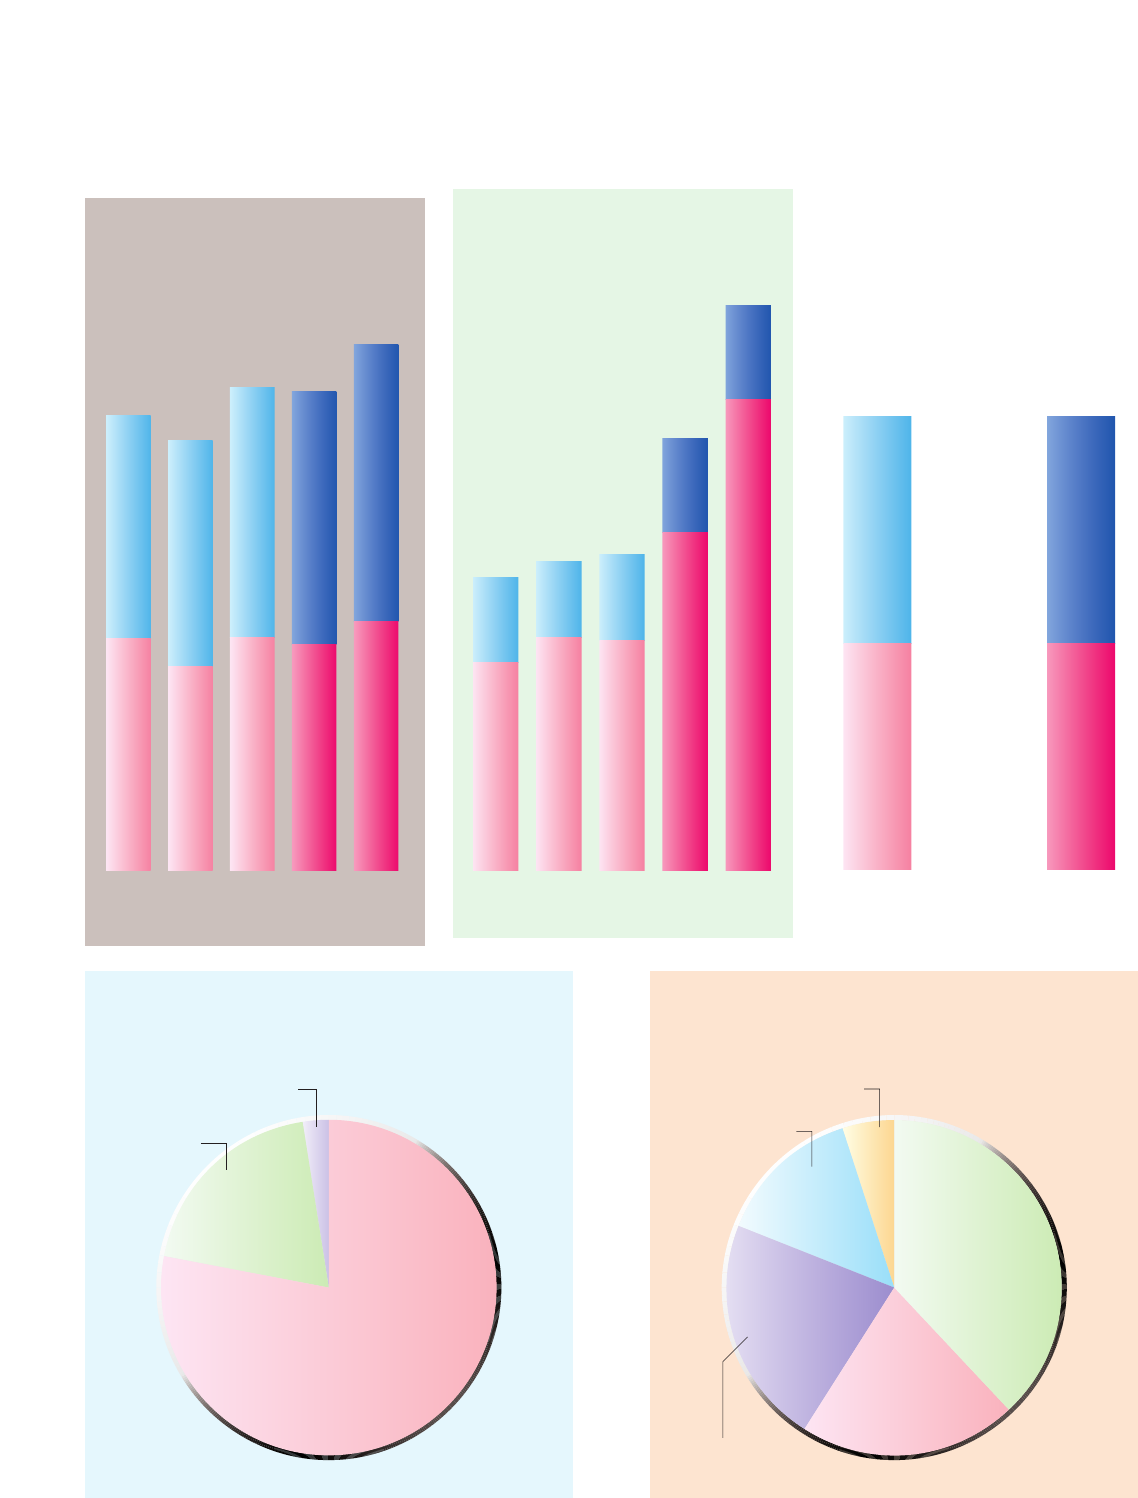
1,739
854
885
1,642
864
778
1,843
952
891
1,830
967
863
2,010
1,540
445
1,095
1,625
402
1,223
1,660
451
1,210
2,268
493
1,775
2,970
Total
PRODUCTION
IN
JAPAN
CBU
PRODUCTION
IN
OVERSEAS
Shipment
units
of
CKD
+
SET
Total
CBU
+
CKD
Total
line-off
units
at each
plants
497
2,473
1,058
952
upto 2003 from 2004
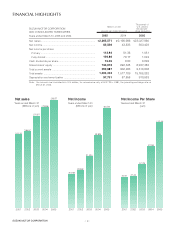
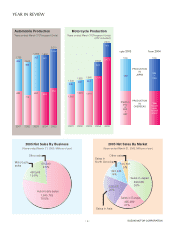
Automobile Production
Years ended March 31(Thousand Units)
2005 Net Sales By Business
(Years ended March 31, 2005, Millions of yen)
Motorcycle Production
Years ended March 31(Thousand Units)
(ATV included)
2001 2002 2003 2004 2005 2001 2002 2003 2004 2005
Other sales
59,240
2.5%
460,568
19.5%
Motorcycle
sales
Automobile sales
1,845,763
78.0%
2005 Net Sales By Market
(Years ended March 31, 2005, Millions of yen)
Other sales
Sales in
North America
Sales in Asia
Sales in Japan
893,065
38%
Sales in Europe
495,989
21%
526,570
22%
324,244
14%
125,701
5%
SUZUKI MOTOR CORPORATION
−4−
YEAR IN REVIEW