Suzuki 2005 Annual Report Download - page 4
Download and view the complete annual report
Please find page 4 of the 2005 Suzuki annual report below. You can navigate through the pages in the report by either clicking on the pages listed below, or by using the keyword search tool below to find specific information within the annual report.-
 1
1 -
 2
2 -
 3
3 -
 4
4 -
 5
5 -
 6
6 -
 7
7 -
 8
8 -
 9
9 -
 10
10 -
 11
11 -
 12
12 -
 13
13 -
 14
14 -
 15
15 -
16
-
17
-
18
-
19
-
20
-
21
-
22
-
23
-
24
-
25
-
26
-
27
-
28
-
29
-
30
-
31
-
32
-
33
-
34
-
35
-
36
-
37
-
38
-
39
-
40
-
41
-
42
-
43
-
44
-
45
-
46
-
47
-
48
-
49
-
50
 |
 |
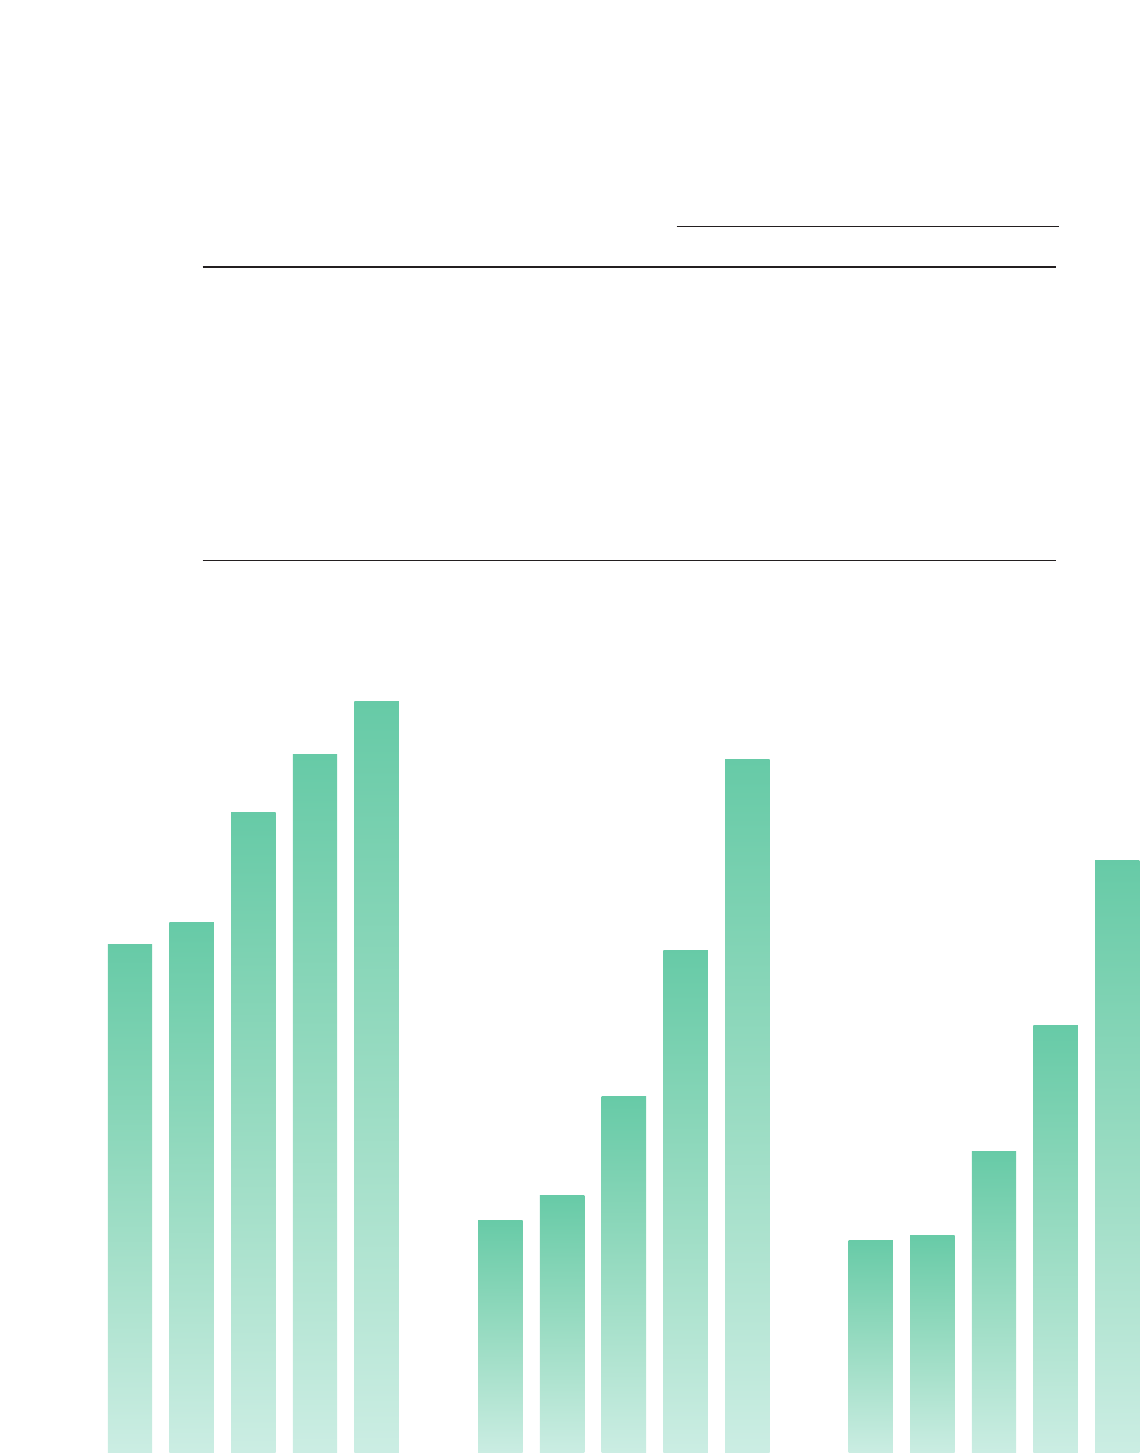
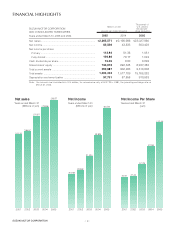
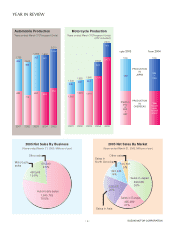
1,600,253
1,668,251
2,015,309
2,198,986
2,365,571
20,248
22,392
31,024
43,835
60,506
40.41 41.40
57.29
81.38
112.94
SUZUKI MOTOR CORPORATION
AND CONSOLIDATED SUBSIDIARIES
Net sales
Net income
Net income per share:
Primary
Fully diluted
Cash dividends per share
Shareholders' equity
Total current assets
Total assets
Depreciation and amortization
...........................................................................
.........................................................................
...........................................................................
....................................................................
..................................................
..........................................................
...........................................................
.......................................................................
...........................................
¥2,365,571
60,506
112.94
109.86
10.00
745,016
999,887
1,693,353
97,731
¥2,198,986
43,835
81.38
79.17
9.00
692,345
902,263
1,577,709
87,858
$22,027,860
563,428
1.051
1.023
0.093
6,937,482
9,310,806
15,768,262
910,063
Years ended March 31, 2005 and 2004
Note: Yen amounts are translated into U.S. dollars, for convenience only, at ¥107.39 = US$1, the prevailing exchange rate on
March 31, 2005.
Millions of yen
(except per share amounts)
Thousands of
U.S. dollars
(except per
share amounts)
2001 2002 2003 2004 2005
Net sales
Years ended March 31
(Millions of yen)
Net Income
Years ended March 31
(Millions of yen)
Net Income Per Share
Years ended March 31
(yen)
2001 2002 2003 2004 2005 2001 2002 2003 2004 2005
2005 2005
2004
SUZUKI MOTOR CORPORATION −3−
FINANCIAL HIGHLIGHTS