Suzuki 2005 Annual Report Download - page 22
Download and view the complete annual report
Please find page 22 of the 2005 Suzuki annual report below. You can navigate through the pages in the report by either clicking on the pages listed below, or by using the keyword search tool below to find specific information within the annual report.-
 1
1 -
2
-
3
-
4
-
5
-
6
-
7
-
8
-
9
-
10
-
11
-
 12
12 -
 13
13 -
 14
14 -
 15
15 -
 16
16 -
 17
17 -
 18
18 -
 19
19 -
 20
20 -
 21
21 -
 22
22 -
 23
23 -
 24
24 -
 25
25 -
 26
26 -
 27
27 -
 28
28 -
 29
29 -
 30
30 -
 31
31 -
 32
32 -
33
-
34
-
35
-
36
-
37
-
38
-
39
-
40
-
41
-
42
-
43
-
44
-
45
-
46
-
47
-
48
-
49
-
50
 |
 |

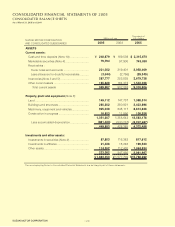
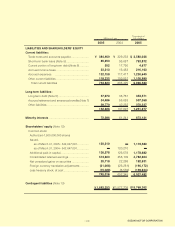
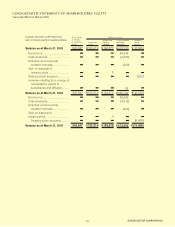
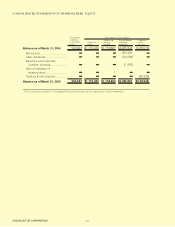
Note: Yen amounts are translated into U.S. dollars for convenience only, at ¥107.39 = US$1, the prevailing exchange rate as of March 31, 2005.
The treasury stock indicated on the column of non-consolidated current assets up to the year of 2001 is listed on the column of shareholders'
equity from the year of 2002 in accordance with the revision of regulations of financial statements.
Calculation of net income per share is made on the adjusted net income basis that bonuses paid to directors and corporate auditors and the
payment of dividends to shareholders of preferred stocks are excluded from net income shown in the income statements from the year of 2003
in accordance with the revision of regulations of financial statements. The figures for 2002 and before are not restated.
CONSOLIDATED
Net sales
Net income
Net income per share :
Primary
Fully diluted
Cash dividends per share
Shareholders' equity
Total current assets
Total assets
Depreciation and amortization
..............................
............................
..............................
.......................
.....
..............
...............
...........................
Years ended March 31
Thousands of
U.S. dollars
(except per
share amounts)
¥2,365,571
60,506
112.94
109.86
10.00
745,016
999,887
1,693,353
97,731
2005
$22,027,860
563,428
1.051
1.023
0.093
6,937,482
9,310,806
15,768,262
910,063
2005
¥2,198,986
43,835
81.38
79.17
9.00
692,345
902,263
1,577,709
87,858
2004
¥2,015,309
31,024
57.29
55.57
9.00
648,357
844,577
1,537,430
83,896
2003
¥1,668,251
22,392
41.40
41.16
8.50
620,004
773,040
1,347,718
75,083
2002
¥1,600,253
20,248
40.41
40.24
8.50
593,770
723,844
1,299,859
75,344
2001
Millions of yen
(except per share amounts)
NON-CONSOLIDATED
Net sales
Net income
Net income per share:
Primary
Fully diluted
Cash dividends per share
Shareholders' equity
Total current assets
Total assets
Depreciation and amortization
..............................
............................
..............................
.......................
.....
..............
...............
...........................
Years ended March 31
Thousands of
U.S. dollars
(except per
share amounts)
¥1,481,632
35,747
66.56
64.75
10.00
540,890
589,848
1,098,073
47,213
2005
$13,796,747
332,872
0.619
0.602
0.093
5,036,691
5,492,584
10,225,098
439,647
2005
¥1,392,688
25,650
47.46
46.17
9.00
518,198
519,025
1,039,261
47,836
2004
¥1,411,418
19,393
35.67
34.61
9.00
483,670
539,322
1,070,708
53,578
2003
¥1,320,218
13,912
25.72
25.59
8.50
477,053
564,830
1,028,709
54,194
2002
¥1,294,651
12,881
25.71
25.61
8.50
475,614
503,543
978,172
52,814
2001
Millions of yen
(except per share amounts)
SUZUKI MOTOR CORPORATION
−22−
FIVE-YEAR SUMMARY
SUZUKI MOTOR CORPORATION