Suzuki 2005 Annual Report Download - page 45
Download and view the complete annual report
Please find page 45 of the 2005 Suzuki annual report below. You can navigate through the pages in the report by either clicking on the pages listed below, or by using the keyword search tool below to find specific information within the annual report.-
 1
1 -
2
-
3
-
4
-
5
-
6
-
7
-
8
-
9
-
10
-
11
-
12
-
13
-
14
-
15
-
16
-
17
-
18
-
19
-
20
-
21
-
22
-
23
-
24
-
25
-
26
-
27
-
28
-
29
-
30
-
31
-
32
-
33
-
34
-
 35
35 -
 36
36 -
 37
37 -
 38
38 -
 39
39 -
 40
40 -
 41
41 -
 42
42 -
 43
43 -
 44
44 -
 45
45 -
 46
46 -
 47
47 -
 48
48 -
 49
49 -
 50
50
 |
 |

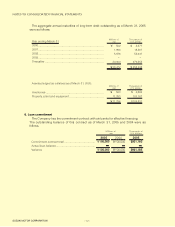
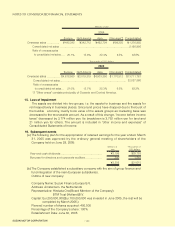
The assets are divided into two groups, i.e. the assets for business and the assets for
rent respectively in business places. Since land prices have dropped due to the burst of
the bubble economy, mainly book value of the assets groups as marketing base was
decreased to the recoverable amount. As a result of this change, "income before income
taxes" decreased by 3,774 million yen. Its breakdown is 3,752 million yen for land and
21 million yen for others. The amount is included in "other income and expenses" of
Consolidated Statements of Income.
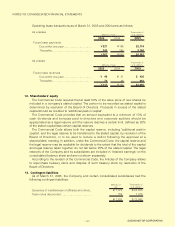
(a) The following plan for the appropriation of retained earnings for the year ended March
31, 2005 was approved by the ordinary general meeting of shareholders of the
Company held on June 29, 2005:
(b) The Company established a subsidiary company with the aim of group finance and
fund integration of the main European subsidiaries.
Outline of new company:
Company Name: Suzuki Finance Europe B.V.
Address: Amsterdam, the Netherlands
Representative: Hirotaka Ono(Board Member of the Company)
BTM Trust (Holland)B.V.
Capital: Eur.200,000,000(Eur.100,000,000 was invested in June 2005, the rest will be
completed by March 2006.)
Planned number of shares acquired: 400,000
Percentage of the Company's share: 100%
Establishment Date: June 30, 2005
16. Subsequent events
NOTES TO CONSOLIDATED FINANCIAL STATEMENTS
SUZUKI MOTOR CORPORATION −45−
.............. .
..............................................................................
....
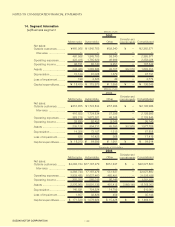
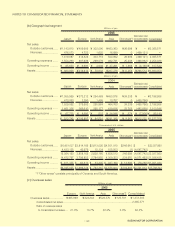
2004
Europe
Millions of yen
¥442,342
20.1% 15.6% 22.4% 4.5% 62.6%
North America
¥342,712
Asia
¥492,704
Other areas*2
¥99,225
Consolidated
¥1,376,985
2,198,986
Overseas sales
Consolidated net sales
Ratio of overseas sales
to consolidated net sales
*2 "Other areas" consists principally of Oceania and Central America.
..............
............................................................................
...
2005
Europe
Thousands of U.S. dollars
$4,618,580
21.0% 13.7% 22.3% 5.3% 62.2%
North America
$3,019,319
Asia
$4,903,350
Other areas*2
$1,170,512
Consolidated
$13,711,761
22,027,860
Overseas sales
Consolidated net sales
Ratio of overseas sales
to consolidated net sales
Year-end cash dividends
Bonuses for directors and corporate auditors
...............................................
...................
Thousands of
U.S. dollars
$29,753
1,862
$31,615
Millions of
yen
¥3,195
200
¥3,395
15. Loss of impairment