Suzuki 2005 Annual Report Download - page 44
Download and view the complete annual report
Please find page 44 of the 2005 Suzuki annual report below. You can navigate through the pages in the report by either clicking on the pages listed below, or by using the keyword search tool below to find specific information within the annual report.-
 1
1 -
2
-
3
-
4
-
5
-
6
-
7
-
8
-
9
-
10
-
11
-
12
-
13
-
14
-
15
-
16
-
17
-
18
-
19
-
20
-
21
-
22
-
23
-
24
-
25
-
26
-
27
-
28
-
29
-
30
-
31
-
32
-
33
-
 34
34 -
 35
35 -
 36
36 -
 37
37 -
 38
38 -
 39
39 -
 40
40 -
 41
41 -
 42
42 -
 43
43 -
 44
44 -
 45
45 -
 46
46 -
 47
47 -
 48
48 -
 49
49 -
 50
50
 |
 |

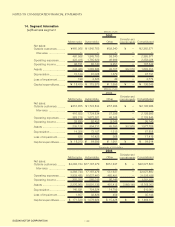
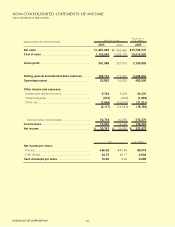
Net sales:
Outside customers
Inter-area
Operating expenses
Operating income
Assets
.....
..................
......
.........
.........................
2005
Millions of yen
Japan Europe
¥1,143,813
476,073
1,619,887
1,554,233
¥ 65,653
¥ 863,958
¥409,605
4,722
414,328
407,636
¥ 6,691
¥213,612
¥ 302,090
1,625
303,716
299,076
¥ 4,639
¥ 78,632
¥483,363
16,699
500,062
462,781
¥ 37,281
¥287,376
¥26,698
0
26,698
25,233
¥ 1,464
¥11,259
¥ −
(499,121)
(499,121)
(490,932)
¥ (8,188)
¥238,514
¥2,365,571
−
2,365,571
2,258,028
¥ 107,542
¥1,693,353
North America
Asia
Other areas*1 Consolidated
Elimination and
corporate assets
Net sales:
Outside customers
Inter-area
Operating expenses
Operating income
Assets
.....
..................
......
.........
.........................
2004
Millions of yen
Japan Europe
¥1,055,969
473,093
1,529,062
1,461,336
¥ 67,725
¥ 823,745
¥373,212
2,390
375,603
366,610
¥ 8,993
¥195,897
¥ 294,489
1,495
295,984
295,177
¥ 807
¥ 84,881
¥450,976
13,787
464,763
439,816
¥ 24,946
¥241,398
¥24,338
0
24,339
23,765
¥ 574
¥ 9,563
¥ −
(490,766)
(490,766)
(482,859)
¥ (7,906)
¥222,222
¥2,198,986
−
2,198,986
2,103,846
¥ 95,140
¥1,577,709
North America
Asia
Other areas*1 Consolidated
Elimination and
corporate assets
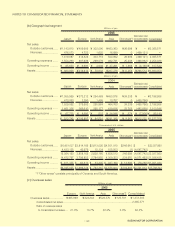
Net sales:
Outside customers
Inter-area
Operating expenses
Operating income
Assets
.....
..................
......
.........
.........................
2005
Thousands of U.S. dollars
Japan Europe
$10,651,027
4,433,125
15,084,153
14,472,797
$ 611,355
$8,045,055
$3,814,185
43,979
3,858,165
3,795,853
$ 62,312
$1,989,128
$2,813,025
15,134
2,828,160
2,784,955
$ 43,205
$ 732,215
$4,501,010
155,503
4,656,513
4,309,353
$ 347,160
$2,676,004
$248,610
(1)
248,609
234,970
$ 13,639
$104,843
$ −
(4,647,742)
(4,647,742)
(4,571,493)
$ (76,248)
$2,221,013
$22,027,860
−
22,027,860
21,026,435
$1,001,424
$15,768,262
North America
Asia
Other areas*1 Consolidated
Elimination and
corporate assets
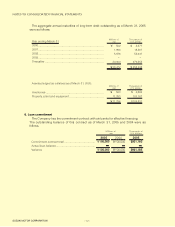
Overseas sales
Consolidated net sales
Ratio of overseas sales
to consolidated net sales
*1 "Other areas" consists principally of Oceania and South America.
.............. .
..............................................................................
....
2005
Europe
Millions of yen
¥495,989
21.0% 13.7% 22.3% 5.3% 62.2%
North America
¥324,244
Asia
¥526,570
Other areas*2
¥125,701
Consolidated
¥1,472,505
2,365,571
(b) Geographical segment
NOTES TO CONSOLIDATED FINANCIAL STATEMENTS
SUZUKI MOTOR CORPORATION
−44−
(c) Overseas sales