Sallie Mae 2000 Annual Report Download - page 2
Download and view the complete annual report
Please find page 2 of the 2000 Sallie Mae annual report below. You can navigate through the pages in the report by either clicking on the pages listed below, or by using the keyword search tool below to find specific information within the annual report.-
 1
1 -
 2
2 -
 3
3 -
 4
4 -
 5
5 -
 6
6 -
 7
7 -
 8
8 -
 9
9 -
 10
10 -
 11
11 -
 12
12 -
 13
13 -
14
-
15
-
16
-
17
-
18
-
19
-
20
-
21
-
22
-
23
 |
 |
like never before
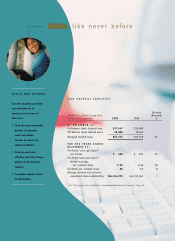
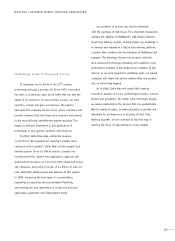
*See "Pro-forma 'Core Cash Basis' Consolidated Statements of Income," Page14.
**Exclusive of certain one-time, non-recurring expenses incurred in the third quarter of 1997 and a one-time integration
charge incurred in the third quarter of 2000.
’96
(dollars in millions)
NET INCOME
’97 ’98 ’99 ’00
”CORE CASH BASIS”*
NET INCOME
0
100
200
300
400
500
$600
’96
(dollars)
DILUTED EPS
’97 ’98 ’99 ’00
”CORE CASH BASIS”*
DILUTED EPS
0
0.5
1.0
1.5
2.0
2.5
3.0
$3.5
’96
(dollars in billions)
ENDING MANAGED
STUDENT LOANS
’97 ’98 ’99 ’00
0
10
20
30
40
50
60
$70
’96
(percent average)
OPERATING EXPENSES**
AS % OF AVERAGE
MANAGED LOANS
’97 ’98 ’99 ’00
0
0.2
0.4
0.6
0.8
1.0
1.2