Sallie Mae 2000 Annual Report Download - page 17
Download and view the complete annual report
Please find page 17 of the 2000 Sallie Mae annual report below. You can navigate through the pages in the report by either clicking on the pages listed below, or by using the keyword search tool below to find specific information within the annual report.-
 1
1 -
2
-
3
-
4
-
5
-
6
-
 7
7 -
 8
8 -
 9
9 -
 10
10 -
 11
11 -
 12
12 -
 13
13 -
 14
14 -
 15
15 -
 16
16 -
 17
17 -
 18
18 -
 19
19 -
 20
20 -
 21
21 -
 22
22 -
 23
23
 |
 |

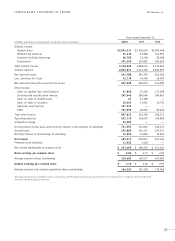
SELECTED FINANCIAL DATA 1996–2000 USA Education, Inc.
15
The following table sets forth selected financial and other operating information of the Company. The selected financial data in the
table is derived from the “Management Discussion and Analysis of Financial Condition and Results of Operations” included in the
Company’s Form 10-K to the Securities and Exchange Commission.
(Dollars in millions, except per share amounts) 2000 1999 1998 1997 1996
OPERATING DATA:
Net interest income $ 642 $ 694 $ 651 $ 781 $ 894
Net income 465 501 501 508 409
Basic earnings per common share 2.84 3.11 2.99 2.80 2.10
Diluted earnings per common share 2.76 3.06 2.95 2.78 2.09
Dividends per common share .66 .61 .57 .52 .47
Return on common stockholders’ equity 49% 78% 81% 65% 50%
Net interest margin 1.52 1.85 1.93 1.80 1.96
Return on assets 1.06 1.28 1.41 1.12 .86
Dividend payout ratio 24 20 19 19 22
Average equity/average assets 2.34 1.59 1.65 1.64 1.66
BALANCE SHEET DATA:
Student loans $37,647 $33,809 $28,283 $29,443 $33,696
Total assets 48,792 44,025 37,210 39,832 47,572
Total borrowings 45,375 41,988 35,399 37,717 45,124
Stockholders’ equity 1,415 841 654 675 834
Book value per common share 7.62 4.29 3.98 3.89 4.44
OTHER DATA:
Securitized student loans outstanding $29,868 $19,467 $18,059 $14,262 $ 6,329
PRO-FORMA “CORE CASH BASIS” RESULTS:
(1)
Net interest income $ 1,039 $ 927 $ 892 $ 937 $ 939
Net income 492 405 381 384 367
Diluted earnings per common share 2.93 2.48 2.24 2.10 1.88
Net interest margin 1.53% 1.68% 1.76% 1.75% 1.89%
Return on assets .71 .71 .72 .70 .71
(1) The pro-forma results present the Company's results of operations under the assumption that the securitization transactions are financings, and that the
securitized student loans were not sold. As such, no gain on sale or subsequent servicing and securitization revenue is recognized. Instead, the earnings of
the student loans in the trusts and related financing costs are reflected over the life of the underlying pool of loans. The effect of floor income, certain
one-time gains on sales of investment securities and student loans, certain one-time, non-recurring expenses incurred in 1997, a one-time integration charge
related to the July 2000 acquisition of USA Group and the amortization of goodwill from acquisitions also are excluded from net income. Management refers
to these pro-forma results as “core cash basis” results. Management monitors the periodic “core cash basis” earnings of the Company’s managed student loan
portfolio and believes that they assist in a better understanding of the Company’s student loan business.