Sallie Mae 2000 Annual Report Download - page 16
Download and view the complete annual report
Please find page 16 of the 2000 Sallie Mae annual report below. You can navigate through the pages in the report by either clicking on the pages listed below, or by using the keyword search tool below to find specific information within the annual report.-
 1
1 -
2
-
3
-
4
-
5
-
 6
6 -
 7
7 -
 8
8 -
 9
9 -
 10
10 -
 11
11 -
 12
12 -
 13
13 -
 14
14 -
 15
15 -
 16
16 -
 17
17 -
 18
18 -
 19
19 -
 20
20 -
 21
21 -
 22
22 -
 23
23
 |
 |

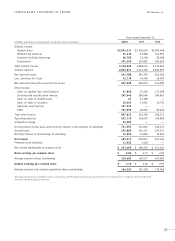
PRO-FORMA “CORE CASH BASIS” CONSOLIDATED STATEMENTS OF INCOME USA Education, Inc.
14
The following pro-forma statements of income present the Company’s results of operations under the assumption that the securitization
transactions are financings, and that the securitized student loans were not sold. As such, no gain on sale or subsequent servicing
and securitization revenue is recognized. Instead, the earnings of the student loans in the trusts and related financing costs are
reflected over the life of the underlying pool of loans. The effect of floor revenue, certain one-time gains on sales of investment
securities and student loans, certain one-time, non-recurring expenses incurred in 1997, a one-time integration charge related
to the July 2000 acquisition of USA Group and the amortization of goodwill from acquisitions also are excluded from net income.
Management refers to these pro-forma results as “core cash basis” statements of income. Management monitors the periodic “core
cash basis” earnings of the Company’s managed student loan portfolio and believes that they assist in a better understanding of
the Company’s student loan business.
Years ended December 31,
(Dollars and shares in thousands, except per share amounts) 2000 1999 1998
Interest income:
Student loans $5,014,858 $3,641,544 $3,311,074
Warehousing advances 56,411 67,828 101,905
Academic facilities financings 66,711 74,358 85,288
Investments 528,957 244,135 298,612
Total interest income 5,666,937 4,027,865 3,796,879
Interest expense 4,627,783 3,101,279 2,905,168
Net interest income 1,039,154 926,586 891,711
Less: provision for losses 52,951 51,289 52,586
Net interest income after provision for losses 986,203 875,297 839,125
Other income:
Gains on sales of securities 1,334 1,303 374
Guarantor servicing fees 127,522 ——
Other 152,349 82,945 86,535
Total other income 281,205 84,248 86,909
Operating expenses 514,093 355,804 360,869
Income before income taxes and minority interest in net earnings of subsidiary 753,315 603,741 565,165
Income taxes 250,128 187,689 173,235
Minority interest in net earnings of subsidiary 10,694 10,694 10,694
Net income 492,493 405,358 381,236
Preferred stock dividends 11,520 1,438 —
Net income attributable to common stock $ 480,973 $ 403,920 $ 381,236
Basic earnings per common share $ 3.02 $ 2.52 $ 2.27
Average common shares outstanding 159,482 160,577 167,684
Diluted earnings per common share $ 2.93 $ 2.48 $ 2.24
Average common and common equivalent shares outstanding 164,355 163,158 170,066