Sallie Mae 2000 Annual Report Download - page 18
Download and view the complete annual report
Please find page 18 of the 2000 Sallie Mae annual report below. You can navigate through the pages in the report by either clicking on the pages listed below, or by using the keyword search tool below to find specific information within the annual report.-
 1
1 -
2
-
3
-
4
-
5
-
6
-
7
-
 8
8 -
 9
9 -
 10
10 -
 11
11 -
 12
12 -
 13
13 -
 14
14 -
 15
15 -
 16
16 -
 17
17 -
 18
18 -
 19
19 -
 20
20 -
 21
21 -
 22
22 -
 23
23
 |
 |

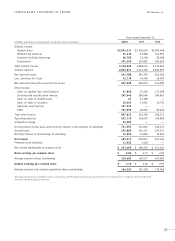
AVERAGE BALANCE SHEETS AND RELATED INCOME/EXPENSE 1996–2000 USA Education, Inc.
16 17
2000 1999 1998 1997 1996
*Income/ *Income/ *Income/ *Income/ *Income/
(Dollars in millions) Balance Expense Rate Balance Expense Rate Balance Expense Rate Balance Expense Rate Balance Expense Rate
ASSETS
Student loans $34,637 $2,854.2 8.24% $33,028 $2,426.5 7.35% $27,589 $2,094.5 7.59% $31,949 $2,485.1 7.78% $33,273 $2,634.5 7.92%
Warehousing advances 825 56.4 6.84 1,173 67.8 5.78 1,718 101.9 5.93 2,518 151.1 6.00 3,206 193.8 6.04
Academic facilities financings 974 82.8 8.50 1,144 93.3 8.16 1,318 107.4 8.15 1,436 123.0 8.57 1,500 126.4 8.43
Investments 7,486 509.7 6.81 3,932 252.4 6.42 4,843 306.9 6.34 9,592 583.6 6.08 9,444 558.5 5.91
Total interest earning assets 43,922 3,503.1 7.98% 39,277 2,840.0 7.23% 35,468 2,610.7 7.36% 45,495 3,342.8 7.35% 47,423 3,513.2 7.41%
Non-interest earning assets 2,711 2,166 2,012 1,916 1,804
Total assets $46,633 $41,443 $37,480 $47,411 $49,227
LIABILITIES AND
STOCKHOLDERS’ EQUITY
Short-term borrowings $35,330 2,266.2 6.41% $33,204 1,762.1 5.31% $24,282 1,297.8 5.34% $26,548 1,462.0 5.51% $20,978 1,138.3 5.43%
Long-term notes 8,636 570.6 6.61 6,292 352.6 5.60 11,194 627.2 5.60 18,677 1,064.2 5.70 26,024 1,444.6 5.55
Total interest bearing liabilities 43,966 2,836.8 6.45% 39,496 2,114.7 5.35% 35,476 1,925.0 5.43% 45,225 2,526.2 5.59% 47,002 2,582.9 5.50%
Non-interest bearing liabilities 1,574 1,287 1,385 1,406 1,410
Stockholders’ equity 1,093 660 619 780 815
Total liabilities and stockholders’ equity $46,633 $41,443 $37,480 $47,411 $49,227
Tax equivalent net interest income
and margin $ 666.3 1.52% $ 725.3 1.85% $ 685.7 1.93% $ 816.6 1.80% $ 930.3 1.96%
Average 91-day Treasury bill rate 6.02% 4.79% 4.93% 5.21% 5.16%
* To compare nontaxable asset yields to taxable yields on a similar basis, income in the above table includes the impact of certain tax-exempt and tax-advantaged
investments based on the marginal corporate tax rate of 35 percent, which represents tax equivalent income.