Salesforce.com 2007 Annual Report Download - page 85
Download and view the complete annual report
Please find page 85 of the 2007 Salesforce.com annual report below. You can navigate through the pages in the report by either clicking on the pages listed below, or by using the keyword search tool below to find specific information within the annual report.-
 1
1 -
2
-
3
-
4
-
5
-
6
-
7
-
8
-
9
-
10
-
11
-
12
-
13
-
14
-
15
-
16
-
17
-
18
-
19
-
20
-
21
-
22
-
23
-
24
-
25
-
26
-
27
-
28
-
29
-
30
-
31
-
32
-
33
-
34
-
35
-
36
-
37
-
38
-
39
-
40
-
41
-
42
-
43
-
44
-
45
-
46
-
47
-
48
-
49
-
50
-
51
-
52
-
53
-
54
-
55
-
56
-
57
-
58
-
59
-
60
-
61
-
62
-
63
-
64
-
65
-
66
-
67
-
68
-
69
-
70
-
71
-
72
-
73
-
74
-
 75
75 -
 76
76 -
 77
77 -
 78
78 -
 79
79 -
 80
80 -
 81
81 -
 82
82 -
 83
83 -
 84
84 -
 85
85 -
 86
86 -
 87
87 -
 88
88 -
 89
89 -
 90
90 -
 91
91 -
 92
92 -
 93
93 -
 94
94 -
 95
95 -
96
-
97
-
98
-
99
 |
 |

Table of Contents
salesforce.com, inc.
Notes to Consolidated Financial Statements—(Continued)
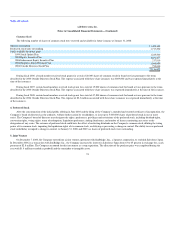
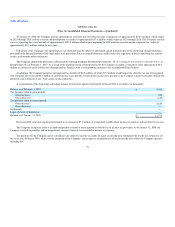
In addition to the resource sharing with the Foundation, the Company issued the Foundation warrants in August 2002 to purchase 500,000 shares of
common stock. Through January 31, 2008, the Foundation exercised all of these warrants. As of January 31, 2008, the Foundation held 247,500 shares of
salesforce.com common stock. Additionally, the Company has donated subscriptions to the Company's service to other qualified non-profit organizations. The
fair value of these donated subscriptions is in excess of $2.0 million per month. The Company plans to continue providing free subscriptions to qualified non-
profit organizations.
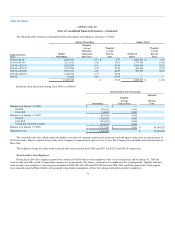
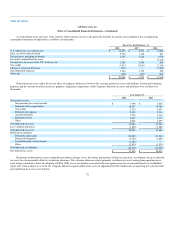
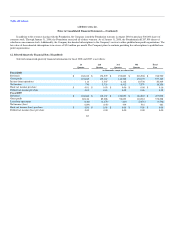
12. Selected Quarterly Financial Data (Unaudited)
Selected summarized quarterly financial information for fiscal 2008 and 2007 is as follows:
1st
Quarter
2nd
Quarter
3rd
Quarter
4th
Quarter
Fiscal
Year
(in thousands, except per share data)
Fiscal 2008
Revenues $ 162,412 $ 176,579 $ 192,803 $ 216,906 $ 748,700
Gross profit 123,245 135,167 148,522 170,175 577,109
Income from operations 114 3,347 6,118 10,730 20,309
Net income 730 3,735 6,512 7,379 18,356
Basic net income per share $ 0.01 $ 0.03 $ 0.06 $ 0.06 $ 0.16
Diluted net income per share 0.01 0.03 0.05 0.06 0.15
Fiscal 2007
Revenues $ 104,686 $ 118,137 $ 130,053 $ 144,222 $ 497,098
Gross profit 80,126 89,006 98,693 110,383 378,208
Loss from operations (120) (1,279) (123) (2,076) (3,598)
Net income (loss) (229) (145) 339 516 481
Basic net income (loss) per share $ 0.00 $ 0.00 $ 0.00 $ 0.00 $ 0.00
Diluted net income (loss) per share 0.00 0.00 0.00 0.00 0.00
82