Salesforce.com 2007 Annual Report Download - page 47
Download and view the complete annual report
Please find page 47 of the 2007 Salesforce.com annual report below. You can navigate through the pages in the report by either clicking on the pages listed below, or by using the keyword search tool below to find specific information within the annual report.-
 1
1 -
2
-
3
-
4
-
5
-
6
-
7
-
8
-
9
-
10
-
11
-
12
-
13
-
14
-
15
-
16
-
17
-
18
-
19
-
20
-
21
-
22
-
23
-
24
-
25
-
26
-
27
-
28
-
29
-
30
-
31
-
32
-
33
-
34
-
35
-
36
-
 37
37 -
 38
38 -
 39
39 -
 40
40 -
 41
41 -
 42
42 -
 43
43 -
 44
44 -
 45
45 -
 46
46 -
 47
47 -
 48
48 -
 49
49 -
 50
50 -
 51
51 -
 52
52 -
 53
53 -
 54
54 -
 55
55 -
 56
56 -
 57
57 -
58
-
59
-
60
-
61
-
62
-
63
-
64
-
65
-
66
-
67
-
68
-
69
-
70
-
71
-
72
-
73
-
74
-
75
-
76
-
77
-
78
-
79
-
80
-
81
-
82
-
83
-
84
-
85
-
86
-
87
-
88
-
89
-
90
-
91
-
92
-
93
-
94
-
95
-
96
-
97
-
98
-
99
 |
 |

Table of Contents
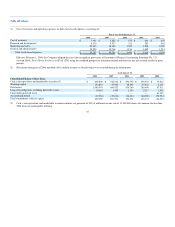
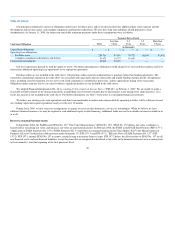
primarily to the increase in the number of paying subscriptions to approximately 1.1 million as of January 31, 2008 from approximately 646,000 as of
January 31, 2007. Professional services and other revenues were $68.1 million, or 9 percent of total revenues, for fiscal 2008, compared to $45.4 million, or 9
percent of total revenues, for the same period a year ago. The increase in professional services and other revenues was due primarily to the higher demand for
services from an increased number of paying subscriptions and customers.
Revenues in Europe and Asia Pacific accounted for $190.7 million, or 25 percent of total revenues, for fiscal 2008, compared to $109.5 million, or 22
percent of total revenues, during the same period a year ago, an increase of $81.2 million, or 74 percent. The increase in revenues outside of the Americas was
the result of our efforts to expand internationally. As part of our overall growth, we expect the percentage of our revenue generated in Europe and Asia Pacific
to continue to increase as a larger percentage of our total revenues world wide.
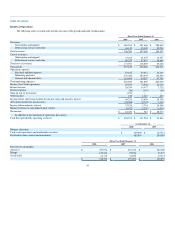
Cost of Revenues. Cost of revenues was $171.6 million, or 23 percent of total revenues, during fiscal 2008, compared to $118.9 million, or 24 percent
of total revenues, during the same period a year ago, an increase of $52.7 million. The increase in absolute dollars was primarily due to an increase of $16.6
million in employee-related costs, an increase of $2.4 million in stock-based expenses, an increase of $14.0 million in service delivery costs, primarily due to
our efforts in increasing data center capacity, an increase of $4.3 million in depreciation and amortization expenses, an increase of $10.2 million in outside
subcontractor and other service costs and an increase of $4.7 million in allocated overhead. The cost of the additional professional services headcount resulted
in the cost of professional services and other revenues to be in excess of the related revenue during fiscal 2008 by $12.2 million. We increased the
professional services headcount in order to meet the current and anticipated demand for our consulting and training services as our subscriber base has
expanded to include more large businesses and as we have expanded internationally.
As described above, we intend to continue to invest additional resources in our on-demand application service and in our capacity to deliver
professional services. The timing of these additional expenses, as well as the costs related to our new data center in Asia, will affect our cost of revenues, both
in terms of absolute dollars and as a percentage of revenues.
We expect the cost of professional services and other revenue to continue to be in excess of the related revenue during fiscal 2009. We plan to make this
investment since our professional services are designed to facilitate the adoption of our on-demand application service. Additionally, as more professional
service arrangements are accounted for as a single unit of accounting with the related subscription service and recognized ratably over the term of the
subscription contract, our costs of professional services will exceed the related revenue recognized.
Research and Development. Research and development expenses were $63.8 million, or 8 percent of total revenues, during fiscal 2008, compared to
$44.6 million, or 9 percent of total revenues, during the same period a year ago, an increase of $19.2 million. The increase in absolute dollars was due to an
increase of $15.0 million in employee-related costs, an increase of $1.8 million in stock-based expenses, and an increase of $2.4 million in allocated overhead.
We increased our research and development headcount by 32 percent since January 31, 2007 in order to upgrade and extend our service offerings and develop
new technologies.
Marketing and Sales. Marketing and sales expenses were $376.5 million, or 50 percent of total revenues, during fiscal 2008, compared to $252.9
million, or 51 percent of total revenues, during the same period a year ago, an increase of $123.6 million. The increase in absolute dollars was primarily due to
increases of $85.9 million in employee-related costs, $7.0 million in stock-based expenses, $10.8 million in advertising costs, $2.2 million in marketing and
event costs, $1.7 million in partner referral fees and $13.9 million in allocated overhead. Our marketing and sales headcount increased by 27 percent since
January 31, 2007 as we hired additional sales personnel to focus on adding new customers and increasing penetration within our existing customer base.
44