Salesforce.com 2007 Annual Report Download - page 76
Download and view the complete annual report
Please find page 76 of the 2007 Salesforce.com annual report below. You can navigate through the pages in the report by either clicking on the pages listed below, or by using the keyword search tool below to find specific information within the annual report.-
 1
1 -
2
-
3
-
4
-
5
-
6
-
7
-
8
-
9
-
10
-
11
-
12
-
13
-
14
-
15
-
16
-
17
-
18
-
19
-
20
-
21
-
22
-
23
-
24
-
25
-
26
-
27
-
28
-
29
-
30
-
31
-
32
-
33
-
34
-
35
-
36
-
37
-
38
-
39
-
40
-
41
-
42
-
43
-
44
-
45
-
46
-
47
-
48
-
49
-
50
-
51
-
52
-
53
-
54
-
55
-
56
-
57
-
58
-
59
-
60
-
61
-
62
-
63
-
64
-
65
-
 66
66 -
 67
67 -
 68
68 -
 69
69 -
 70
70 -
 71
71 -
 72
72 -
 73
73 -
 74
74 -
 75
75 -
 76
76 -
 77
77 -
 78
78 -
 79
79 -
 80
80 -
 81
81 -
 82
82 -
 83
83 -
 84
84 -
 85
85 -
 86
86 -
87
-
88
-
89
-
90
-
91
-
92
-
93
-
94
-
95
-
96
-
97
-
98
-
99
 |
 |
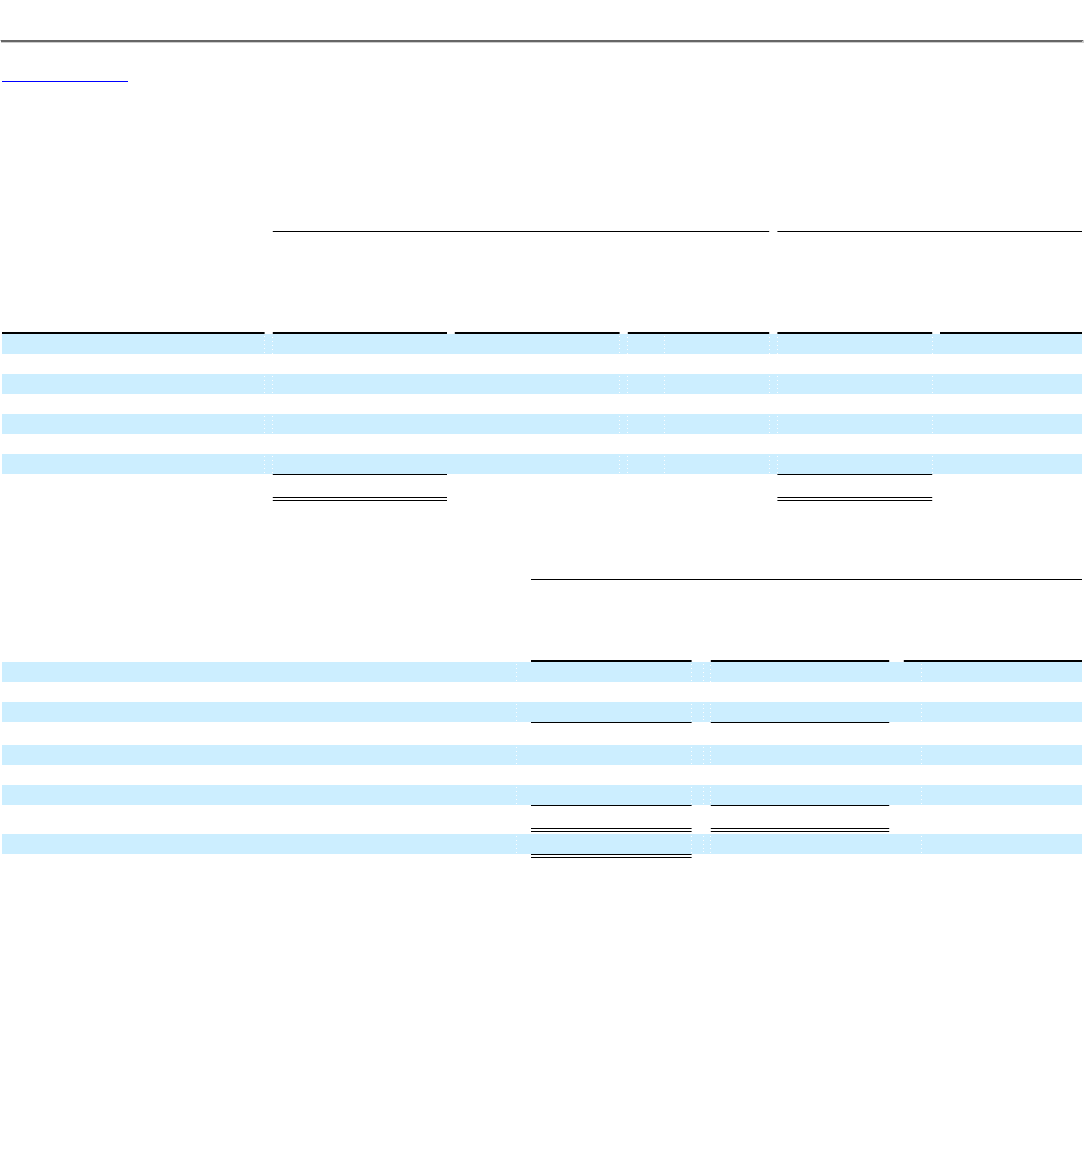
Table of Contents
salesforce.com, inc.
Notes to Consolidated Financial Statements—(Continued)
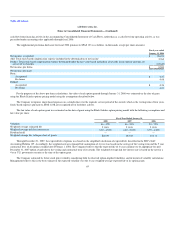
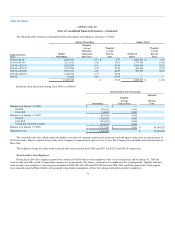
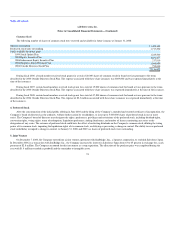
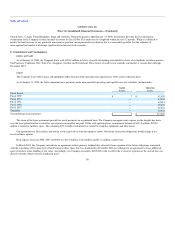
The following table summarizes information about stock options outstanding as of January 31, 2008:
Options Outstanding Options Vested
Range of Exercise
Prices
Number
Outstanding
Weighted-
Average
Remaining
Contractual
Life (Years)
Weighted-
Average
Exercise
Price
Number of
Shares
Weighted-
Average
Exercise
Price
$0.40 to $4.00 2,001,243 5.17 $ 2.37 2,001,243 $ 2.37
$6.00 to $13.89 2,231,416 6.40 10.91 1,774,466 10.48
$14.39 to $29.35 2,823,524 5.61 23.40 1,096,914 22.36
$30.40 to $38.39 2,176,996 4.42 35.50 696,995 35.25
$39.35 to $52.28 2,391,312 4.80 44.27 299,399 39.89
$52.48 to $54.22 1,685,454 4.77 52.58 — —
$63.98 99,400 4.90 63.98 — —
13,409,345 $ 27.83 5,869,017 $ 14.38
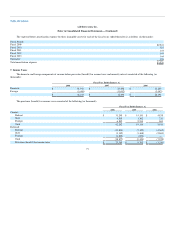
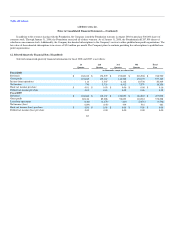
Restricted stock unit activity during fiscal 2008 is as follows:
Restricted Stock Units Outstanding
Outstanding
Weighted-
Average
Exercise Price
Aggregate
Intrinsic
Value
Balance as of January 31, 2006 $ — $ —
Granted 876,303 0.001
Cancelled (34,625) 0.001
Balance as of January 31, 2007 841,678 0.001
Granted 1,326,520 0.001
Cancelled (216,873) 0.001
Vested and converted to shares (234,035) 0.001
Balance as of January 31, 2008 1,717,290 $ 0.001 $ 89,144,325
Expected to vest 1,449,748 $ 75,242,206
The restricted stock units, which entitles the holder to one share of common stock for each restricted stock unit upon vesting, have an exercise price of
$0.001 per share, which is equal to the par value of the Company's common stock, and vest over 4 years. The Company first awarded restricted stock units in
May 2006.
The weighted-average fair value of the restricted stock units issued in fiscal 2008 and 2007 was $48.26 and $34.60, respectively.
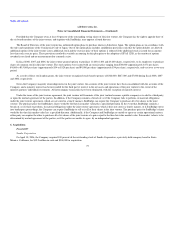
Stock Awards to Non-Employees
During fiscal 2004, the Company granted stock awards of 100,000 shares to non-employees with 4 year vesting terms and by January 31, 2008 the
stock awards were fully vested. Compensation expense was re-measured as the shares vested and was recorded over the vesting periods. Together with past
stock awards to non-employees, such expenses amounted to $249,000, $413,000 and $279,000 for fiscal 2008, 2007 and 2006, respectively. Such expense
was estimated using the Black-Scholes pricing model using similar assumptions as those for valuing stock option awards to employees.
73