Royal Caribbean Cruise Lines 2008 Annual Report Download - page 45
Download and view the complete annual report
Please find page 45 of the 2008 Royal Caribbean Cruise Lines annual report below. You can navigate through the pages in the report by either clicking on the pages listed below, or by using the keyword search tool below to find specific information within the annual report.
Royal Caribbean Cruises Ltd. 29
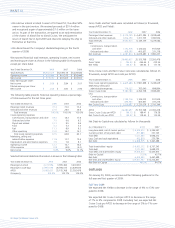
Other income decreased to $15.8 million in 2007 from $28.1 million
in 2006. The decrease was primarily due to a $36.0 million gain on the
settlement of a lawsuit in 2006 that did not recur in 2007, partially off-
set by a gain of $23.1 million related to certain derivative instruments
associated with our ship construction firm commitments denominated
in euros that did not qualify for hedge accounting treatment.
Net Yields
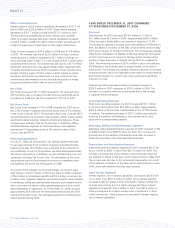
Net Yields increased 3.3% in 2007 compared to 2006 primarily due to,
as mentioned above, the addition of Pullmantur’s tour business and,
to a lesser extent, an increase in ticket prices on a per passenger basis
partially offset by a decrease in onboard revenues. Occupancy in 2007
was 105.7% compared to 106.5% in 2006.
Net Cruise Costs
Net Cruise Costs increased 19.8% in 2007 compared to 2006 due
to the 12.3% increase in capacity mentioned above and a 6.6%
increase in Net Cruise Costs per APCD. The increase in Net Cruise
Costs per APCD was primarily driven by increases in other operating
expenses. Other operating expenses increased primarily due to the
addition of Pullmantur’s tour business which adds costs without cor-
responding capacity.
RECENTLY ADOPTED, AND FUTURE APPLICATION OF,
ACCOUNTING STANDARDS
Refer to Note 2. Summary of Significant Accounting Policies to
our consolidated financial statements for further information on
Recently Adopted Accounting Standards and Future Application
of Accounting Standards.
LIQUIDITY AND CAPITAL RESOURCES
Sources and Uses of Cash
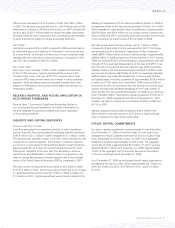
Cash flow generated from operations provides us with a significant
source of liquidity. Net cash provided by operating activities decreased
$197.4 million to $1.1 billion in 2008 compared to $1.3 billion in 2007.
This decrease was primarily a result of a $118.5 million decrease in cash
received from customer deposits. The decrease in customer deposits
is a result of a compression in the booking window, forward bookings
lagging behind the prior year and cruises being purchased for lower
ticket prices compared to the prior year. The decrease in customer
deposits was also attributable, to a lesser extent, to a decrease in the
value of foreign denominated customer deposits due to the strength-
ening of the United States dollar during 2008 as compared to 2007.
Net cash used in investing activities increased to $2.0 billion in 2008
from $1.2 billion in 2007. The increase was primarily due to an increase
in capital expenditures which were $2.2 billion in 2008, compared to
$1.3 billion in 2007. Capital expenditures were primarily related to the
delivery of Independence of the Seas and Celebrity Solstice in 2008 as
compared to Liberty of the Seas and the purchase of Pacific Star in 2007.
These expenditures were partially offset by settlements of approximately
$269.8 million and $59.4 million on our foreign currency forward con-
tracts in 2008 and 2007, respectively along with proceeds from the sale
of our investment in Island Cruises of $51.4 million in 2008.
Net cash provided by financing activities was $1.1 billion in 2008
compared to $36.6 million for the same period in 2007. The change
was primarily due to a decrease in repayments of debt of approxi-
mately $818.3 million and an increase in debt proceeds of approximately
$288.4 million, in 2008 compared to the same period in 2007. During
2008, we received $530.0 million through an unsecured term loan due
through 2015 to purchase Independence of the Seas and $519.1 mil-
lion, through an unsecured term loan due through 2020 to purchase
Celebrity Solstice. We also borrowed approximately $1.2 billion under
our unsecured revolving credit facility of which we repaid approximately
$595.0 million. We made debt repayments on various loan facilities
and capital leases, including a payment of approximately $150.0 million
to retire our 6.75% senior notes due March 2008. During 2008, we
received $3.8 million in connection with the exercise of common stock
options and paid cash dividends pertaining to the fourth quarter of
2007 and the first, second and third quarters of 2008 on our common
stock of $128.0 million. Net Debt-to-Capital increased to 49.3% as of
December 31, 2008 compared to 44.7% as of December 31, 2007.
Similarly, our Debt-to-Capital ratio increased to 50.8% in 2008 from
45.7% in 2007.
Interest capitalized during 2008 increased to $44.4 million from
$39.9 million for the same period in 2007 due to a higher average
level of investment in ships under construction.
FUTURE CAPITAL COMMITMENTS
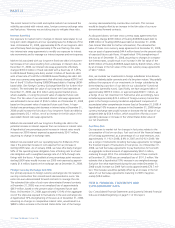
Our future capital commitments consist primarily of new ship orders.
As of December 31, 2008, we had two ships of a new Oasis-class
designated for Royal Caribbean International and four Solstice-class
ships, designated for Celebrity Cruises, on order for an aggregate
additional capacity of approximately 22,200 berths. The aggregate
cost of the six ships is approximately $6.5 billion, of which we have
deposited $540.1 million as of December 31, 2008. Approximately
13.9% of the aggregate cost of ships was exposed to fluctuations
in the euro exchange rate at December 31, 2008.
As of December 31, 2008 we anticipated overall capital expenditures,
including the six ships on order, will be approximately $2.1 billion for
2009, $2.2 billion for 2010, $1.0 billion for 2011, and $1.0 billion
for 2012.
PART II


