Royal Caribbean Cruise Lines 2008 Annual Report Download - page 3
Download and view the complete annual report
Please find page 3 of the 2008 Royal Caribbean Cruise Lines annual report below. You can navigate through the pages in the report by either clicking on the pages listed below, or by using the keyword search tool below to find specific information within the annual report.-
 1
1 -
 2
2 -
 3
3 -
 4
4 -
 5
5 -
 6
6 -
 7
7 -
 8
8 -
 9
9 -
 10
10 -
 11
11 -
 12
12 -
 13
13 -
 14
14 -
15
-
16
-
17
-
18
-
19
-
20
-
21
-
22
-
23
-
24
-
25
-
26
-
27
-
28
-
29
-
30
-
31
-
32
-
33
-
34
-
35
-
36
-
37
-
38
-
39
-
40
-
41
-
42
-
43
-
44
-
45
-
46
-
47
-
48
-
49
-
50
-
51
-
52
-
53
-
54
-
55
-
56
-
57
-
58
-
59
-
60
-
61
-
62
-
63
-
64
-
65
-
66
-
67
-
68
-
69
-
70
-
71
-
72
-
73
-
74
-
75
-
76
 |
 |

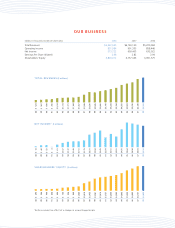
(dollars in thousands, except per share data) 2008 2007 2006
Total Revenues $6,532,525 $6,149,139 $5,229,584
Operating Income 831,984 901,335 858,446
Net Income 573,722 603,405 633,922
Earnings Per Share (diluted) 2.68 2.82 2.94
Shareholders’ Equity 6,803,012 6,757,343 6,091,575
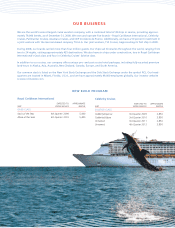
OUR BUSINESS
*Before cumulative effect of a change in accounting principle
TOTAL REVENUES ($ millions)
88
91
95
98
02
06
89
92
96
99
03
07
90
94
93
97
01
05
00
04
08
$ 523
$ 567
$ 698
$ 760
$1,013
$1,357
$1,171
$2,636
$3,145
$4,555
$6,149
$1,113
$1,939
$2,866
$3,784
$5,230
$1,184
$2,546
$3,434
$4,903
$6,533
NET INCOME* ($ millions)
$ 14
$ 42
$ 52
$ 4
$ 61
$151
$137
$331
$254
$475
$603
$107
$175
$445
$281
$634
$149
$384
$351
$663
$574
88
91
95
98
02
06
89
92
96
99
03
07
90
94
93
97
01
05
00
04
08
SHAREHOLDERS’ EQUITY ($ millions)
$ 295
$ 348
$ 400
$ 404
$ 464
$1,085
$ 846
$2,455
$3,757
$4,805
$6,757
$ 733
$2,019
$3,616
$4,263
$6,092
$ 965
$3,261
$4,035
$5,554
$6,803
88
91
95
98
02
06
89
92
96
99
03
07
90
94
93
97
01
05
00
04
08