Royal Caribbean Cruise Lines 2008 Annual Report Download - page 42
Download and view the complete annual report
Please find page 42 of the 2008 Royal Caribbean Cruise Lines annual report below. You can navigate through the pages in the report by either clicking on the pages listed below, or by using the keyword search tool below to find specific information within the annual report.-
 1
1 -
2
-
3
-
4
-
5
-
6
-
7
-
8
-
9
-
10
-
11
-
12
-
13
-
14
-
15
-
16
-
17
-
18
-
19
-
20
-
21
-
22
-
23
-
24
-
25
-
26
-
27
-
28
-
29
-
30
-
31
-
 32
32 -
 33
33 -
 34
34 -
 35
35 -
 36
36 -
 37
37 -
 38
38 -
 39
39 -
 40
40 -
 41
41 -
 42
42 -
 43
43 -
 44
44 -
 45
45 -
 46
46 -
 47
47 -
 48
48 -
 49
49 -
 50
50 -
 51
51 -
 52
52 -
53
-
54
-
55
-
56
-
57
-
58
-
59
-
60
-
61
-
62
-
63
-
64
-
65
-
66
-
67
-
68
-
69
-
70
-
71
-
72
-
73
-
74
-
75
-
76
 |
 |

26 Royal Caribbean Cruises Ltd.
s We sold our interest in Island Cruises to TUI Travel PLC, the other 50%
owner in the joint venture. We received proceeds of $51.4 million
and recognized a gain of approximately $1.0 million on the trans-
action. As part of the transaction, we agreed to an early termination
of the charter of Island Star to Island Cruises. We anticipate the
return of Island Star in April 2009 and intend to redeploy the ship to
Pullmantur at that time.
s We discontinued the Company’s dividend beginning in the fourth
quarter of 2008.
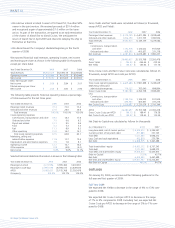
We reported historical total revenues, operating income, net income
and earnings per share as shown in the following table (in thousands,
except per share data):
Year Ended December 31, 2008 2007 2006
Total revenues $6,532,525 $6,149,139 $5,229,584
Operating income $ 831,984 $ 901,335 $ 858,446
Net income $ 573,722 $ 603,405 $ 633,922
Basic earnings per share:
Net income $ 2.69 $ 2.84 $ 3.01
Diluted earnings per share:
Net income $ 2.68 $ 2.82 $ 2.94
The following table presents historical operating data as a percentage
of total revenues for the last three years:
Year Ended December 31, 2008 2007 2006
Passenger ticket revenues 72.4 72.0 73.4
Onboard and other revenues 27.6 28.0 26.6
Total revenues 100.0% 100.0% 100.0%
Cruise operating expenses
Commissions, transportation and other 18.3 18.3 17.6
Onboard and other 7.0 6.6 6.3
Payroll and related 10.1 9.5 9.6
Food
5.2 5.3 5.3
Fuel 11.1 8.9 9.2
Other
operating 15.8 16.2 14.1
Total cruise operating expenses 67.5 64.8 62.1
Marketing, selling and
administrative
expenses 11.9 12.7 13.4
Depreciation and amortization expenses 7.9 7.8 8.1
Operating income 12.7 14.7 16.4
Other expense (3.9) (4.9) (4.3)
Net income 8.8% 9.8% 12.1%
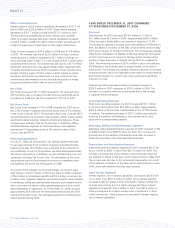
Selected historical statistical information is shown in the following table:
Year Ended December 31, 2008 2007 2006
Passengers Carried 4,017,554 3,905,384 3,600,807
Passenger Cruise Days 27,657,578 26,594,515 23,849,606
APCD 26,463,637 25,155,768 22,392,478
Occupancy 104.5% 105.7% 106.5%
Gross Yields and Net Yields were calculated as follows (in thousands,
except APCD and Yields):
Year Ended December 31, 2008 2007 2006
Passenger ticket revenues $ 4,730,289 $ 4,427,384 $ 3,838,648
Onboard and other revenues 1,802,236 1,721,755 1,390,936
Total revenues 6,532,525 6,149,139 5,229,584
Less:
Commissions,
transportation
and other 1,192,316 1,124,022 917,929
Onboard and other 458,385 405,637 331,218
Net revenues $ 4,881,824 $ 4,619,480 $ 3,980,437
APCD 26,463,637 25,155,768 22,392,478
Gross Yields $ 246.85 $ 244.44 $ 233.54
Net Yields $ 184.47 $ 183.64 $ 177.76
Gross Cruise Costs and Net Cruise Costs were calculated as follows (in
thousands, except APCD and costs per APCD):
Year Ended December 31, 2008 2007 2006
Total cruise operating expenses $ 4,403,666 $ 3,981,698 $ 3,249,629
Marketing, selling and
administrative
expenses 776,522 783,040 699,864
Gross Cruise Costs 5,180,188 4,764,738 3,949,493
Less:
Commissions,
transportation
and other 1,192,316 1,124,022 917,929
Onboard and other 458,385 405,637 331,218
Net Cruise Costs $ 3,529,487 $ 3,235,079 $ 2,700,346
APCD 26,463,637 25,155,768 22,392,478
Gross Cruise Costs per APCD $ 195.75 $ 189.41 $ 176.38
Net Cruise Costs per APCD $ 133.37 $ 128.60 $ 120.59
Net Debt-to-Capital was calculated as follows (in thousands):
As of December 31, 2008 2007
Long-term debt, net of current portion $ 6,539,510 $ 5,346,547
Current portion of long-term debt 471,893 351,725
Total debt 7,011,403 5,698,272
Less: Cash and cash equivalents 402,878 230,784
Net Debt $ 6,608,525 $ 5,467,488
Total shareholders’ equity $ 6,803,012 $ 6,757,343
Total debt 7,011,403 5,698,272
Total debt and shareholders’ equity 13,814,415 12,455,615
Debt-to-Capital
50.8% 45.7%
Net Debt 6,608,525 5,467,488
Net Debt and shareholders’ equity $13,411,537 $12,224,831
Net Debt-to-Capital 49.3% 44.7%
OUTLOOK
On January 29, 2009, we announced the following guidance for the
full year and first quarter of 2009:
Full Year 2009
We expected Net Yields to decrease in the range of 9% to 13% com-
pared to 2008.
We expected Net Cruise Costs per APCD to decrease in the range
of 7% to 9% compared to 2008. Excluding fuel, we expected Net
Cruise Costs per APCD to decrease in the range of 5% to 7% com-
pared to 2008.
PART II