Royal Caribbean Cruise Lines 2008 Annual Report Download - page 37
Download and view the complete annual report
Please find page 37 of the 2008 Royal Caribbean Cruise Lines annual report below. You can navigate through the pages in the report by either clicking on the pages listed below, or by using the keyword search tool below to find specific information within the annual report.
Royal Caribbean Cruises Ltd. 21
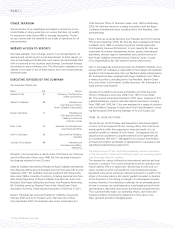
ITEM 6. SELECTED FINANCIAL DATA
The selected consolidated financial data presented below for the years 2004 through 2008 and as of the end of each such year, are derived from
our audited financial statements and should be read in conjunction with those financial statements and the related notes.
(in thousands, except per share data)
Year Ended December 31, 2008 2007 2006 2005 2004
Operating Data:
Total revenues $ 6,532,525 $ 6,149,139 $ 5,229,584 $ 4,903,174 $ 4,555,375
Operating income 831,984 901,335 858,446 871,565 753,589
Income before cumulative effect of a change in accounting principle 573,722 603,405 633,922 663,465 474,691
Cumulative effect of a change in accounting principle 1
– – – 52,491 –
Net income 573,722 603,405 633,922 715,956 474,691
Per Share Data – Basic:
Income before cumulative effect of a change in accounting principle $ 2.69 $ 2.84 $ 3.01 $ 3.22 $ 2.39
Cumulative effect of a change in accounting principle
1
$ – $ – $ – $ 0.25 $ –
Net income $ 2.69 $ 2.84 $ 3.01 $ 3.47 $ 2.39
Weighted-average shares 213,477 212,784 210,703 206,217 198,946
Per Share Data – Diluted:
Income before cumulative effect of a change in accounting principle $ 2.68 $ 2.82 $ 2.94 $ 3.03 $ 2.26
Cumulative effect of a change in accounting principle
1
$ – $ – $ – $ 0.22 $ –
Net income $ 2.68 $ 2.82 $ 2.94 $ 3.26 $ 2.26
Weighted-average shares and potentially dilutive shares 214,195 214,255 221,485 234,714 234,580
Dividends declared per common share $ 0.45 $ 0.60 $ 0.60 $ 0.56 $ 0.52
Balance Sheet Data:
Total assets $16,463,310 $14,982,281 $13,393,088 $11,255,771 $11,964,084
Total debt, including capital leases 7,011,403 5,698,272 5,413,744 4,154,775 5,731,944
Common stock 2,239 2,235 2,225 2,165 2,012
Total shareholders’ equity 6,803,012 6,757,343 6,091,575 5,554,465 4,804,520
1 In the third quarter of 2005, we changed our method of accounting for drydocking costs from the accrual in advance to the deferral method. Under the accrual in advance
method, estimated drydocking costs are accrued evenly over the period to the next scheduled drydock. Under the deferral method, drydocking costs incurred are deferred
and charged to expense on a straight-line basis over the period to the next scheduled drydock. The deferral method is preferable because it only recognizes the liability when
incurred and does not require the use of estimates inherent in the accrual in advance method.
PART II
ITEM 7. MANAGEMENT’S DISCUSSION AND
ANALYSIS OF FINANCIAL CONDITION AND
RESULTS OF OPERATIONS
CAUTIONARY NOTE CONCERNING FACTORS
THAT MAY AFFECT FUTURE RESULTS
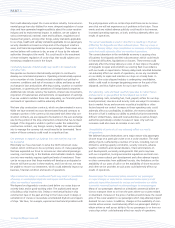
Certain statements under this caption “Management’s Discussion and
Analysis of Financial Condition and Results of Operations” and elsewhere
in this document constitute forward-looking statements under the Private
Securities Litigation Reform Act of 1995. Words such as “anticipate,”
“believe,” “could,” “estimate,” “expect,” “goal,” “intend,” “may,”
“plan,” “project,” “seek,” “should,” “will,” and similar expressions
are intended to identify these forward-looking statements. Forward-
looking statements do not guarantee future performance and may
involve risks, uncertainties and other factors, which could cause our
actual results, performance or achievements to differ materially from
the future results, performance or achievements expressed or implied
in those forward-looking statements. Examples of these risks, uncer-
tainties and other factors include, but are not limited to those
discussed under Item 1A. Risk Factors as well as the following:
s the adverse impact of the continuing worldwide economic downturn
on the demand for cruises,
s the impact of the economic downturn on the availability of our credit
facility and on our ability to generate cash flows from operations or
obtain new borrowings from the credit or capital markets in amounts
sufficient to satisfy our capital expenditures, debt repayments and
other financing needs,
s the impact of disruptions in the global financial markets on the ability
of our counterparties and others to perform their obligations to us,
s the uncertainties of conducting business internationally and expand-
ing into new markets,
s the volatility in fuel prices and foreign exchange rates,
s the impact of changes in operating and financing costs, including
changes in foreign currency, interest rates, fuel, food, payroll, airfare
for our shipboard personnel, insurance and security costs,
s the impact of problems encountered at shipyards and their subcon-
tractors including insolvency or financial difficulties,
s vacation industry competition and changes in industry capacity and
overcapacity,
s the impact of tax and environmental laws and regulations affecting
our business or our principal shareholders,
s the impact of changes in other laws and regulations affecting our
business,
s the impact of pending or threatened litigation, enforcement actions,
fines or penalties,
s the impact of delayed or cancelled ship orders,


