Red Lobster 2009 Annual Report Download - page 64
Download and view the complete annual report
Please find page 64 of the 2009 Red Lobster annual report below. You can navigate through the pages in the report by either clicking on the pages listed below, or by using the keyword search tool below to find specific information within the annual report.-
 1
1 -
2
-
3
-
4
-
5
-
6
-
7
-
8
-
9
-
10
-
11
-
12
-
13
-
14
-
15
-
16
-
17
-
18
-
19
-
20
-
21
-
22
-
23
-
24
-
25
-
26
-
27
-
28
-
29
-
30
-
31
-
32
-
33
-
34
-
35
-
36
-
37
-
38
-
39
-
40
-
41
-
42
-
43
-
44
-
45
-
46
-
47
-
48
-
49
-
50
-
51
-
52
-
53
-
 54
54 -
 55
55 -
 56
56 -
 57
57 -
 58
58 -
 59
59 -
 60
60 -
 61
61 -
 62
62 -
 63
63 -
 64
64 -
 65
65 -
 66
66 -
 67
67 -
 68
68 -
 69
69 -
 70
70 -
 71
71 -
 72
72 -
 73
73 -
 74
74
 |
 |

62 Darden Restaurants, Inc. 2009 Annual Report
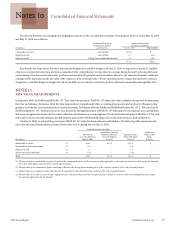
Notes to Consolidated Financial Statements
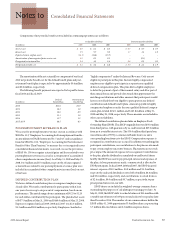
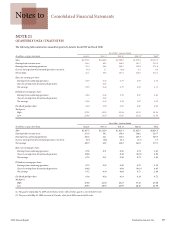
The following table presents the weighted-average assumptions used to determine benefit obligations and net expense:
Defined Benefit Plans Postretirement Benefit Plan
2009 2008 2009 2008
Weighted-average assumptions used to determine
benefit obligations at May 31 and May 25 (1)
Discount rate 7.00% 6.50% 7.10% 6.50%
Rate of future compensation increases 3.75% 3.75% N/A N/A
Weighted-average assumptions used to determine
net expense for fiscal years ended May 31 and May 25 (2)
Discount rate 6.50% 5.80% 6.50% 5.80%
Expected long-term rate of return on plan assets 9.00% 9.00% N/A N/A
Rate of future compensation increases 3.75% 3.75% N/A N/A
(1) Determined as of the end of fiscal year.
(2) Determined as of the beginning of fiscal year.
We set the discount rate assumption annually for each of the
plans at their valuation dates to reflect the yield of high-quality fixed-
income debt instruments, with lives that approximate the maturity
of the plan benefits. The expected long-term rate of return on plan
assets and health care cost trend rates are based upon several factors,
including our historical assumptions compared with actual results, an
analysis of current market conditions, asset fund allocations and the
views of leading financial advisers and economists. Our target asset fund
allocation is 35 percent U.S. equities, 30 percent high-quality, long-
duration fixed-income securities, 15 percent international equities,
10 percent real assets and 10 percent private equities. We monitor our
actual asset fund allocation to ensure that it approximates our target
allocation and believe that our long-term asset fund allocation will
continue to approximate our target allocation.
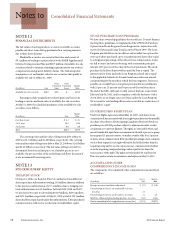
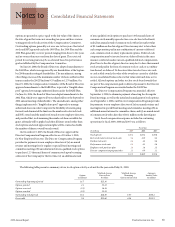
The defined benefit pension plans have the following asset
fund allocations at their measurement dates of May 31, 2009 and
February 29, 2008, respectively:
Asset Fund Classification 2009 2008
U.S. equities 34% 32%
High-quality, long-duration fixed-income securities 26% 25%
International equities 14% 18%
Real assets 13% 12%
Private equities 13% 13%
Total 100% 100%
For fiscal 2009, 2008 and 2007, we have used an expected long-term
rate of return on plan assets for our defined benefit plan of 9.0 percent.
In developing our expected rate of return assumption, we have
evaluated the actual historical performance and long-term return
projections of the plan assets, which give consideration to the asset
mix and the anticipated timing of the pension plan outflows. We
employ a total return investment approach whereby a mix of equity
and fixed income investments are used to maximize the long-term
return of plan assets for what we consider a prudent level of risk. Our
historical ten-year rate of return on plan assets, calculated using the
geometric method average of returns, is approximately 5.7 percent as
of May 31, 2009.
The discount rate and expected return on plan assets assumptions
have a significant effect on amounts reported for defined benefit
pension plans. A quarter percentage point change in the defined
benefit plans’ discount rate and the expected long-term rate of return
on plan assets would increase or decrease earnings before income
taxes by $0.7 million and $0.5 million, respectively.
The assumed health care cost trend rate increase in the per-capita
charges for postretirement benefits was 8.0 percent for fiscal 2010.
The rate gradually decreases to 4.5 percent through fiscal 2020 and
remains at that level thereafter.
The assumed health care cost trend rate has a significant effect
on amounts reported for retiree health care plans. A one percentage
point variance in the assumed health care cost trend rate would increase
or decrease the total of the service and interest cost components of net
periodic postretirement benefit cost by $0.8 million and $0.7 million,
respectively, and would increase or decrease the accumulated postre-
tirement benefit obligation by $4.5 million and $3.6 million, respectively.