Red Lobster 2003 Annual Report Download - page 47
Download and view the complete annual report
Please find page 47 of the 2003 Red Lobster annual report below. You can navigate through the pages in the report by either clicking on the pages listed below, or by using the keyword search tool below to find specific information within the annual report.-
 1
1 -
2
-
3
-
4
-
5
-
6
-
7
-
8
-
9
-
10
-
11
-
12
-
13
-
14
-
15
-
16
-
17
-
18
-
19
-
20
-
21
-
22
-
23
-
24
-
25
-
26
-
27
-
28
-
29
-
30
-
31
-
32
-
33
-
34
-
35
-
36
-
 37
37 -
 38
38 -
 39
39 -
 40
40 -
 41
41 -
 42
42 -
 43
43 -
 44
44 -
 45
45 -
 46
46 -
 47
47 -
 48
48 -
 49
49 -
 50
50 -
 51
51 -
 52
52 -
 53
53 -
 54
54 -
 55
55 -
 56
56
 |
 |

2003 ANNUAL REPORT 45
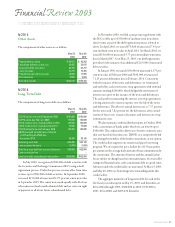
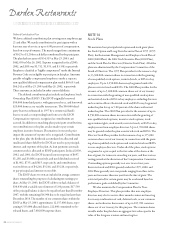
The per share weighted-average fair value of stock options
granted during fiscal 2003, 2002, and 2001 was $9.01, $6.05,
and $4.48, respectively. These amounts were determined using
the Black Scholes option-pricing model, which values options
based on the stock price at the grant date, the expected life of the
option, the estimated volatility of the stock, expected dividend
payments, and the risk-free interest rate over the expected life of
the option. The dividend yield was calculated by dividing the
current annualized dividend by the option exercise price for each
grant. The expected volatility was determined considering stock
prices for the fiscal year the grant occurred and prior fiscal years,
as well as considering industry volatility data. The risk-free interest
rate was the rate available on zero coupon U.S. government
obligations with a term equal to the remaining term for each
grant. The expected life of the option was estimated based on
the exercise history from previous grants.
The weighted-average assumptions used in the Black
Scholes model were as follows:
Stock Options
Granted in Fiscal Year
2003 2002 2001
Risk-free interest rate 4.37% 4.50% 7.00%
Expected volatility of stock 30.0% 30.0% 30.0%
Dividend yield 0.2% 0.1% 0.1%
Expected option life 6.0 years 6.0 years 6.0 years
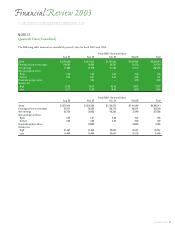
Financial Review 2003
Notes to Consolidated Financial Statements
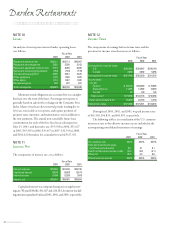
Stock option activity during the periods indicated was as follows:
Weighted-Average Weighted-Average
Options Exercise Price Options Exercise Price
Exercisable Per Share Outstanding Per Share
Balance at May 29, 2000 10,068,389 $7.12 26,352,761 $ 8.98
Options granted 5,375,727 $10.99
Options exercised (4,670,100) $ 7.00
Options cancelled (926,100) $10.82
Balance at May 27, 2001 12,222,339 $7.62 26,132,288 $ 9.68
Options granted 5,776,350 $17.36
Options exercised (4,310,327) $ 8.36
Options cancelled (675,776) $13.49
Balance at May 26, 2002 12,152,538 $8.31 26,922,535 $11.44
Options granted 4,200,086 $25.99
Options exercised (3,132,894) $ 9.23
Options cancelled (1,298,094) $16.86
Balance at May 25, 2003 13,481,166 $9.59 26,691,633 $13.73
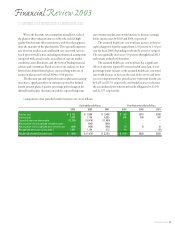
The following table provides information regarding exercisable and outstanding options as of May 25, 2003:
Weighted-Average Weighted-Average Weighted-Average
Range of Exercise Options Exercise Options Exercise Remaining Contractual
Price Per Share Exercisable Price Per Share Outstanding Price Per Share Life (Years)
$ 4.00 - $10.00 7,089,174 $ 6.99 7,090,672 $ 6.99 2.5
$10.01 - $15.00 5,904,902 12.03 10,492,834 11.96 5.8
$15.01 - $20.00 432,208 16.85 5,133,444 17.03 8.2
Over $20.00 54,882 25.39 3,974,683 26.16 9.1
13,481,166 $ 9.59 26,691,633 $13.73 5.9