Red Lobster 2003 Annual Report Download - page 32
Download and view the complete annual report
Please find page 32 of the 2003 Red Lobster annual report below. You can navigate through the pages in the report by either clicking on the pages listed below, or by using the keyword search tool below to find specific information within the annual report.-
 1
1 -
2
-
3
-
4
-
5
-
6
-
7
-
8
-
9
-
10
-
11
-
12
-
13
-
14
-
15
-
16
-
17
-
18
-
19
-
20
-
21
-
 22
22 -
 23
23 -
 24
24 -
 25
25 -
 26
26 -
 27
27 -
 28
28 -
 29
29 -
 30
30 -
 31
31 -
 32
32 -
 33
33 -
 34
34 -
 35
35 -
 36
36 -
 37
37 -
 38
38 -
 39
39 -
 40
40 -
 41
41 -
 42
42 -
43
-
44
-
45
-
46
-
47
-
48
-
49
-
50
-
51
-
52
-
53
-
54
-
55
-
56
 |
 |

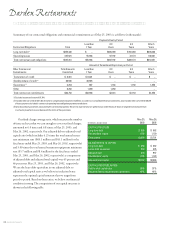
30 DARDEN RESTAURANTS
Darden Restaurants
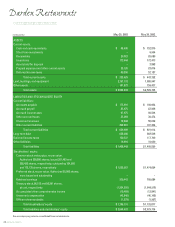
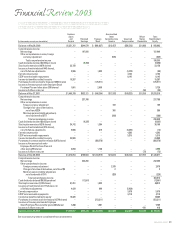
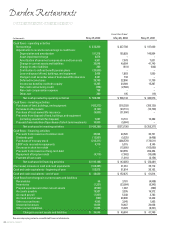
Consolidated Statements of Cash Flows
Fiscal Year Ended
(In thousands) May 25, 2003 May 26, 2002 May 27, 2001
Cash flows – operating activities
Net earnings $ 232,260 $ 237,788 $ 197,000
Adjustments to reconcile net earnings to cash flows:
Depreciation and amortization 191,218 165,829 146,864
Asset impairment charge 4,876 ––
Amortization of unearned compensation and loan costs 6,901 7,578 7,031
Change in current assets and liabilities 36,046 49,604 41,740
Change in other liabilities 280 (619) (642)
Contribution to defined benefit pension plans (20,000) ––
Loss on disposal of land, buildings, and equipment 2,456 1,803 1,559
Change in cash surrender value of trust-owned life insurance 2,441 743 –
Deferred income taxes 35,749 22,800 11,750
Income tax benefits credited to equity 16,385 24,989 15,287
Non-cash restructuring credit (358) (2,568) –
Non-cash compensation expense 758 ––
Other, net 280 195 (19)
Net cash provided by operating activities $ 509,292 $ 508,142 $ 420,570
Cash flows – investing activities
Purchases of land, buildings, and equipment (423,273) (318,392) (355,139)
Increase in other assets (8,163) (24,741) (10,730)
Purchase of trust-owned life insurance (6,000) (31,500) –
Proceeds from disposal of land, buildings, and equipment
(including assets held for disposal) 7,047 10,741 13,492
Proceeds from maturities of (purchases of) short-term investments 10,000 (9,904) –
Net cash used in investing activities $ (420,389) $ (373,796) $ (352,377)
Cash flows – financing activities
Proceeds from issuance of common stock 33,664 40,520 36,701
Dividends paid (13,501) (9,225) (9,458)
Purchases of treasury stock (213,311) (208,578) (176,511)
ESOP note receivable repayments 4,710 5,315 8,145
Decrease in short-term debt – (12,000) (103,000)
Proceeds from issuance of long-term debt – 149,655 224,454
Repayment of long-term debt (4,710) (7,962) (10,658)
Payment of loan costs – (1,010) (2,154)
Net cash used in financing activities $ (193,148) $ (43,285) $ (32,481)
(Decrease) increase in cash and cash equivalents (104,245) 91,061 35,712
Cash and cash equivalents – beginning of year 152,875 61,814 26,102
Cash and cash equivalents – end of year $ 48,630 $ 152,875 $ 61,814
Cash flows from changes in current assets and liabilities
Receivables 66 3,781 (4,908)
Inventories (1,231) (23,984) (6,242)
Prepaid expenses and other current assets (8,523) 1,987 (289)
Accounts payable 15,927 3,205 16,372
Accrued payroll (1,961) 5,348 4,783
Accrued income taxes (529) 20,806 14,442
Other accrued taxes 4,595 3,045 1,905
Unearned revenues 16,066 18,487 24,008
Other current liabilities 11,636 16,929 (8,331)
Change in current assets and liabilities $ 36,046 $ 49,604 $ 41,740
See accompanying notes to consolidated financial statements.