Red Lobster 2003 Annual Report Download - page 20
Download and view the complete annual report
Please find page 20 of the 2003 Red Lobster annual report below. You can navigate through the pages in the report by either clicking on the pages listed below, or by using the keyword search tool below to find specific information within the annual report.-
 1
1 -
2
-
3
-
4
-
5
-
6
-
7
-
8
-
9
-
 10
10 -
 11
11 -
 12
12 -
 13
13 -
 14
14 -
 15
15 -
 16
16 -
 17
17 -
 18
18 -
 19
19 -
 20
20 -
 21
21 -
 22
22 -
 23
23 -
 24
24 -
 25
25 -
 26
26 -
 27
27 -
 28
28 -
 29
29 -
 30
30 -
31
-
32
-
33
-
34
-
35
-
36
-
37
-
38
-
39
-
40
-
41
-
42
-
43
-
44
-
45
-
46
-
47
-
48
-
49
-
50
-
51
-
52
-
53
-
54
-
55
-
56
 |
 |

18 DARDEN RESTAURANTS
Darden Restaurants
ManagementÕs Discussion and Analysis of Financial Condition and Results of Operations
This discussion and analysis should be read in conjunction with
our consolidated financial statements and related notes found
elsewhere in this report.
As of May 25, 2003, Darden Restaurants, Inc. operated
1,271 Red Lobster, Olive Garden, Bahama Breeze, Smokey
Bones BBQ, and Seasons 52 restaurants in the United States
and Canada and licensed 33 restaurants in Japan. We own and
operate all of our restaurants in the U.S. and Canada, with no
franchising. Our fiscal year ends on the last Sunday in May.
Fiscal 2003, 2002, and 2001 each consisted of 52 weeks
of operation.
On March 21, 2002, our Board of Directors declared
a three-for-two split of our common stock. The stock split was
accomplished through a 50 percent stock dividend, which was
distributed on May 1, 2002 to stockholders of record as of the
close of business on April 10, 2002. All applicable references in
this discussion and analysis to number of shares and per share
amounts of common stock have been adjusted to reflect the
stock split.
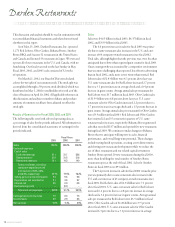
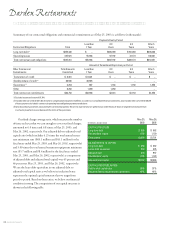
Results of Operations for Fiscal 2003, 2002, and 2001
The following table sets forth selected operating data as
a percentage of sales for the periods indicated. All information is
derived from the consolidated statements of earnings for the
periods indicated.
Fiscal Years
2003 2002 2001
Sales 100.0% 100.0% 100.0%
Costs and expenses:
Cost of sales:
Food and beverage 31.1 31.7 32.6
Restaurant labor 31.9 31.5 31.6
Restaurant expenses 15.1 14.3 14.0
Total cost of sales, excluding
restaurant depreciation and
amortization of 3.8%, 3.6%,
and 3.5%, respectively 78.1% 77.5% 78.2%
Selling, general, and administrative 9.4 9.6 9.8
Depreciation and amortization 4.1 3.8 3.7
Interest, net 0.9 0.9 0.8
Restructuring credit – (0.1) –
Total costs and expenses 92.5% 91.7% 92.5%
Earnings before income taxes 7.5 8.3 7.5
Income taxes 2.5 2.9 2.6
Net earnings 5.0% 5.4% 4.9%
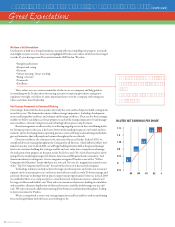
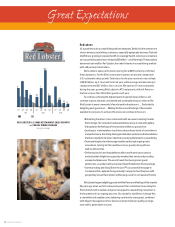
Sales
Sales were $4.65 billion in fiscal 2003, $4.37 billion in fiscal
2002, and $3.99 billion in fiscal 2001.
The 6.6 percent increase in sales for fiscal 2003 was prima-
rily due to same-restaurant sales increases in the U.S. and a net
increase of 60 company-owned restaurants since fiscal 2002.
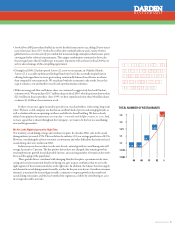
Total sales, although higher than the previous year, were less than
anticipated due to lower than expected guest counts for fiscal 2003.
Guest count growth was restrained by a competitive environment
that was more challenging than expected, less effective advertising
than in fiscal 2002, and a more severe winter than normal. Red
Lobster sales of $2.43 billion were 4.1 percent above last year.
U.S. same-restaurant sales for Red Lobster increased 2.7 percent
due to a 3.1 percent increase in average check and a 0.4 percent
decrease in guest counts. Average annual sales per restaurant for
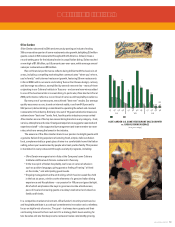
Red Lobster were $3.7 million in fiscal 2003. Olive Garden sales
of $1.99 billion were 6.8 percent above last year. U.S. same-
restaurant sales for Olive Garden increased 2.2 percent due to a
3.7 percent increase in average check and a 1.5 percent decrease in
guest counts. Average annual sales per restaurant for Olive Garden
were $3.9 million in fiscal 2003. Red Lobster and Olive Garden
have enjoyed 22 and 35 consecutive quarters of U.S. same-
restaurant sales increases, respectively. Bahama Breeze generated
sales that exceeded $137 million and opened five new restaurants
during fiscal 2003. We continue to make changes to Bahama
Breeze that we anticipate will improve its sales, financial
performance, and overall long-term potential. These changes
include testing lunch operations, creating a new dinner menu,
and slowing new restaurant development while we reduce the
size of these restaurants and our related capital investment.
Smokey Bones opened 20 new restaurants during fiscal 2003,
more than doubling the total number of Smokey Bones
restaurants open at the end of fiscal 2002. Sales for Smokey
Bones in fiscal 2003 were $93 million.
The 9.4 percent increase in sales for fiscal 2002 versus the prior
year was primarily due to same-restaurant sales increases in the
U.S. and a net increase of 43 company-owned restaurants since
fiscal 2001. Red Lobster sales of $2.34 billion were 7.1 percent
above fiscal 2001. U.S. same-restaurant sales for Red Lobster
increased 6.2 percent due to a 2.8 percent increase in average
check and a 3.4 percent increase in guest counts. Average annual
sales per restaurant for Red Lobster were $3.5 million in fiscal
2002. Olive Garden sales of $1.86 billion were 9.5 percent
above fiscal 2001. U.S. same-restaurant sales for Olive Garden
increased 6.3 percent due to a 3.1 percent increase in average