Red Lobster 2003 Annual Report Download - page 45
Download and view the complete annual report
Please find page 45 of the 2003 Red Lobster annual report below. You can navigate through the pages in the report by either clicking on the pages listed below, or by using the keyword search tool below to find specific information within the annual report.-
 1
1 -
2
-
3
-
4
-
5
-
6
-
7
-
8
-
9
-
10
-
11
-
12
-
13
-
14
-
15
-
16
-
17
-
18
-
19
-
20
-
21
-
22
-
23
-
24
-
25
-
26
-
27
-
28
-
29
-
30
-
31
-
32
-
33
-
34
-
 35
35 -
 36
36 -
 37
37 -
 38
38 -
 39
39 -
 40
40 -
 41
41 -
 42
42 -
 43
43 -
 44
44 -
 45
45 -
 46
46 -
 47
47 -
 48
48 -
 49
49 -
 50
50 -
 51
51 -
 52
52 -
 53
53 -
 54
54 -
 55
55 -
56
 |
 |

2003 ANNUAL REPORT 43
We set the discount rate assumption annually for each of
the plans at their valuation dates to reflect the yield of high-
quality fixed-income debt instruments, with lives that approxi-
mate the maturity of the plan benefits. The expected long-term
rate of return on plan assets and health care cost trend rates are
based upon several factors, including our historical assumptions
compared with actual results, an analysis of current market
conditions, asset allocations, and the views of leading financial
advisers and economists. Based on our recent analysis, we have
lowered our defined benefit plans’ expected long-term rate of
return on plan assets for fiscal 2004 to 9.00 percent.
The discount rate and expected return on plan assets assump-
tions have a significant effect on amounts reported for defined
benefit pension plans. A quarter percentage point change in the
defined benefit plans’ discount rate and the expected long-term
rate of return on plan assets would increase or decrease earnings
before income taxes by $610 and $360, respectively.
The assumed health care cost trend rate increase in the per-
capita charges for benefits ranged from 12.0 percent to 13.0 per-
cent for fiscal 2004, depending on the medical service category.
The rates gradually decrease to 5.0 percent through fiscal 2011
and remain at that level thereafter.
The assumed health care cost trend rate has a significant
effect on amounts reported for retiree health care plans. A one-
percentage-point variance in the assumed health care cost trend
rate would increase or decrease the total of the service and inter-
est cost components of net periodic post-retirement benefit cost
by $207 and $179, respectively, and would increase or decrease
the accumulated post-retirement benefit obligation by $3,013
and $2,377, respectively.
Financial Review 2003
Notes to Consolidated Financial Statements
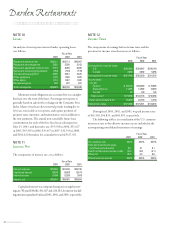
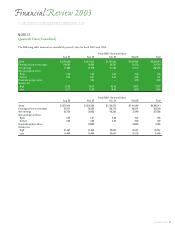
Components of net periodic benefit (income) cost are as follows:
Defined Benefit Plans Post-Retirement Benefit Plan
2003 2002 2001 2003 2002 2001
Service cost $ 3,732 $ 3,586 $ 3,488 $ 388 $291 $246
Interest cost 7,088 7,145 6,255 648 500 447
Expected return on plan assets (12,739) (12,416) (11,589) –––
Amortization of unrecognized transition asset – (642) (642) –––
Amortization of unrecognized prior service cost (348) (456) (456) 18 18 18
Recognized net actuarial loss (gain) 1,924 1,104 213 46 – (18)
Net periodic benefit (income) cost $ (343) $ (1,679) $ (2,731) $ 1,100 $809 $693