Red Lobster 2001 Annual Report Download - page 42
Download and view the complete annual report
Please find page 42 of the 2001 Red Lobster annual report below. You can navigate through the pages in the report by either clicking on the pages listed below, or by using the keyword search tool below to find specific information within the annual report.-
 1
1 -
2
-
3
-
4
-
5
-
6
-
7
-
8
-
9
-
10
-
11
-
12
-
13
-
14
-
15
-
16
-
17
-
18
-
19
-
20
-
21
-
22
-
23
-
24
-
25
-
26
-
27
-
28
-
29
-
30
-
31
-
 32
32 -
 33
33 -
 34
34 -
 35
35 -
 36
36 -
 37
37 -
 38
38 -
 39
39 -
 40
40 -
 41
41 -
 42
42 -
 43
43 -
 44
44 -
 45
45 -
 46
46 -
 47
47 -
 48
48 -
 49
49
 |
 |

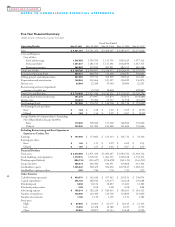
NOTES TO CONSOLIDATED FINANCIAL STATEMENTS
Five Year Financial Summary
(Dollar amounts in thousands, except per share data)
Fiscal Year Ended
Operating Results May 27, 2001 May 28, 2000 May 30, 1999 May 31, 1998 May 25, 1997
Sales $ 4,021,157 $ 3,701,256 $ 3,458,107 $ 3,287,017 $ 3,171,810
Costs and Expenses:
Cost of Sales:
Food and beverage 1,302,926 1,199,709 1,133,705 1,083,629 1,077,316
Restaurant labor 1,261,837 1,181,156 1,117,401 1,062,490 1,017,315
Restaurant expenses 569,963 519,832 493,811 482,311 481,348
Total Cost of Sales $ 3,134,726 $ 2,900,697 $ 2,744,917 $ 2,628,430 $ 2,575,979
Restaurant Operating Profit 886,431 800,559 713,190 658,587 595,831
Selling, general, and administrative 407,685 379,731 360,909 358,542 361,263
Depreciation and amortization 146,864 130,464 125,327 126,289 136,876
Interest, net 30,664 22,388 19,540 20,084 22,291
Restructuring and asset impairment
expense or (credit), net (5,931) (8,461) 229,887
Total Costs and Expenses $ 3,719,939 $ 3,427,349 $ 3,242,232 $ 3,133,345 $ 3,326,296
Earnings (loss) before income taxes 301,218 273,907 215,875 153,672 (154,486)
Income taxes 104,218 97,202 75,337 51,958 (63,457)
Net Earnings (Loss) $ 197,000 $ 176,705 $ 140,538 $ 101,714 $ (91,029)
Net Earnings (Loss) per Share:
Basic $ 1.64 $ 1.38 $ 1.02 $ 0.69 $ (0.59)
Diluted $ 1.59 $ 1.34 $ 0.99 $ 0.67 $ (0.59)
Average Number of Common Shares Outstanding,
Net of Shares Held in Treasury (in 000’s):
Basic 119,800 128,500 137,300 148,300 155,600
Diluted 123,800 131,900 141,400 151,400 155,600
Excluding Restructuring and Asset Impairment
Expense or (Credit), Net
Earnings $ 197,000 $ 173,082 $ 135,313 $ 101,714 $ 54,330
Earnings per share:
Basic $ 1.64 $ 1.35 $ 0.99 $ 0.69 $ 0.35
Diluted $ 1.59 $ 1.31 $ 0.96 $ 0.67 $ 0.35
Financial Position
Total assets $ 2,218,458 $ 1,971,423 $ 1,890,247 $ 1,984,742 $ 1,963,722
Land, buildings, and equipment 1,779,515 1,578,541 1,461,535 1,490,348 1,533,272
Working capital (deficit) (226,116) (316,427) (194,478) (161,123) (143,211)
Long-term debt 520,574 306,586 316,451 310,608 313,192
Stockholders’ equity 1,035,242 960,470 964,036 1,019,845 1,081,213
Stockholders’ equity per share 8.82 7.86 7.30 7.23 7.07
Other Statistics
Cash flow from operations $ 420,570 $ 342,626 $ 357,942 $ 239,933 $ 190,074
Capital expenditures 355,139 268,946 123,673 112,168 159,688
Dividends paid 9,458 10,134 10,857 11,681 12,385
Dividends paid per share 0.08 0.08 0.08 0.08 0.08
Advertising expense $ 196,314 $ 182,220 $ 180,563 $ 186,261 $ 204,321
Number of employees 128,900 122,300 116,700 114,800 114,600
Number of restaurants 1,168 1,139 1,139 1,151 1,182
Stock price:
High $ 29.490 $ 23.063 $ 23.375 $ 18.125 $ 12.125
Low 15.438 12.438 14.188 8.125 6.750
Close 28.900 18.875 21.313 15.438 8.250
40
2001
DARDEN RESTAURANTS