Red Lobster 2001 Annual Report Download - page 20
Download and view the complete annual report
Please find page 20 of the 2001 Red Lobster annual report below. You can navigate through the pages in the report by either clicking on the pages listed below, or by using the keyword search tool below to find specific information within the annual report.-
 1
1 -
2
-
3
-
4
-
5
-
6
-
7
-
8
-
9
-
 10
10 -
 11
11 -
 12
12 -
 13
13 -
 14
14 -
 15
15 -
 16
16 -
 17
17 -
 18
18 -
 19
19 -
 20
20 -
 21
21 -
 22
22 -
 23
23 -
 24
24 -
 25
25 -
 26
26 -
 27
27 -
 28
28 -
 29
29 -
 30
30 -
31
-
32
-
33
-
34
-
35
-
36
-
37
-
38
-
39
-
40
-
41
-
42
-
43
-
44
-
45
-
46
-
47
-
48
-
49
 |
 |

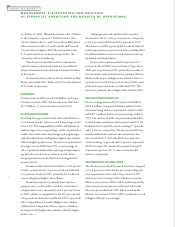
MANAGEMENT’S DISCUSSION AND ANALYSIS
OF FINANCIAL CONDITION AND RESULTS OF OPERATIONS
1
2001
DARDEN RESTAURANTS
As of May 27, 2001, Darden Restaurants, Inc. (Darden
or the Company) operated 1,168 Red Lobster, Olive
Garden, Bahama Breeze, and Smokey Bones BBQ Sports
Bar restaurants in the U.S. and Canada and licensed
34 restaurants in Japan. All of the restaurants in the
U.S. and Canada are owned and operated by the
Company with no franchising.
This discussion should be read in conjunction
with the business information and the consolidated
financial statements and related notes found elsewhere
in this report.
Darden’s fiscal year ends on the last Sunday in May.
Fiscal years ended 2001, 2000, and 1999 each consisted
of 52 weeks of operation.
REVENUES
Total revenues in 2001 were $4.02 billion, an 8.6 per-
cent increase from 2000. Total revenues in 2000 were
$3.70 billion, a 7.0 percent increase from 1999.
COSTS AND EXPENSES
Food and beverage costs for both 2001 and 2000 were
32.4 percent of sales, a decrease of 0.4 percentage points
from 1999. The comparability in 2001 and 2000 food
and beverage costs, as a percentage of sales, is primarily a
result of favorable menu-mix changes, pricing changes,
and other efficiencies resulting from higher sales volumes,
offset by higher product costs. The decrease in food and
beverage costs in 2000 from 1999, as a percentage of
sales, is primarily attributable to pricing, margin improv-
ing initiatives such as waste reduction, and a lower-
margin promotion run by Red Lobster during the first
quarter of 1999.
Restaurant labor decreased in 2001 to 31.4 percent
of sales, compared to 31.9 percent of sales in 2000 and
32.3 percent of sales in 1999, primarily due to efficien-
cies resulting from higher sales volumes.
Restaurant expenses (primarily lease expenses,
property taxes, credit card fees, utilities, and workers’
compensation costs) amounted to 14.2 percent of sales
in 2001, which was comparable to the 14.1 percent and
14.3 percent of sales levels in 2000 and 1999, respectively.
The comparability is a result of higher sales volumes
and the fixed component of these expenses which are
not impacted by higher sales volumes, offset by higher
utility costs.
Selling, general, and administrative expenses
decreased in 2001 to 10.1 percent of sales, compared
to 10.3 percent in 2000 and 10.4 percent in 1999.
The decrease in 2001 is principally a result of reduced
marketing expenses as a percent of sales, partially offset
by additional labor costs associated with new concept
expansion and development.
Depreciation and amortization expense of 3.7
percent of sales in 2001 increased from 3.5 percent in
2000 and 3.6 percent in 1999, primarily as a result of
new restaurant and remodel activity, partially offset by
the favorable impact of higher sales volumes. Interest
expense increased to 0.8 percent of sales in 2001, com-
pared to 0.6 percent of sales in 2000 and 1999. The
increase is primarily due to higher debt levels in 2001.
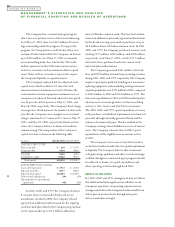
INCOME FROM OPERATIONS
Pre-tax earnings increased by 12.4 percent in 2001 to
$301.2 million, compared to $268.0 million (before
net restructuring and asset impairment credit) in 2000
and $207.4 million (before net restructuring credit) in
1999. The increase in 2001 was primarily attributable
to annual same-restaurant sales increases in the U.S. for
both Red Lobster and Olive Garden totaling 5.9 percent
and 7.2 percent, respectively. The increase in 2000 was
mainly attributable to annual same-restaurant sales
increases in the U.S. for both Red Lobster and Olive
Garden totaling 7.6 percent and 7.2 percent, respectively.
Red Lobster and Olive Garden have enjoyed 14 and 27
consecutive quarters of U.S. same-restaurant sales
increases, respectively.
PROVISION FOR INCOME TAXES
The effective tax rate for 2001 was 34.6 percent, compared
to 35.4 percent in 2000 (before net restructuring and
asset impairment credit) and 34.8 percent in 1999
(before net restructuring credit). The decrease in the
effective tax rate from 2000 to 2001 resulted primarily
from increases in income tax credits and deductions
that were not available in 2000. The increase in the
effective tax rate from 1999 to 2000 is primarily a result
of higher 2000 pre-tax earnings.