Red Lobster 2001 Annual Report Download - page 37
Download and view the complete annual report
Please find page 37 of the 2001 Red Lobster annual report below. You can navigate through the pages in the report by either clicking on the pages listed below, or by using the keyword search tool below to find specific information within the annual report.-
 1
1 -
2
-
3
-
4
-
5
-
6
-
7
-
8
-
9
-
10
-
11
-
12
-
13
-
14
-
15
-
16
-
17
-
18
-
19
-
20
-
21
-
22
-
23
-
24
-
25
-
26
-
 27
27 -
 28
28 -
 29
29 -
 30
30 -
 31
31 -
 32
32 -
 33
33 -
 34
34 -
 35
35 -
 36
36 -
 37
37 -
 38
38 -
 39
39 -
 40
40 -
 41
41 -
 42
42 -
 43
43 -
 44
44 -
 45
45 -
 46
46 -
 47
47 -
48
-
49
 |
 |

NOTES TO CONSOLIDATED FINANCIAL STATEMENTS
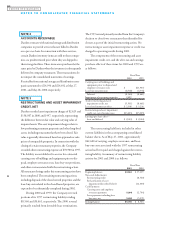
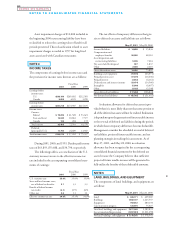
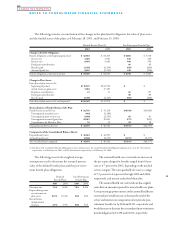
The following provides a reconciliation of the changes in the plan benefit obligation, fair value of plan assets,
and the funded status of the plans as of February 28, 2001, and February 29, 2000:
Defined Benefit Plans (1) Post-Retirement Benefit Plan
2001 2000 2001 2000
Change in Benefit Obligation:
Benefit obligation at the beginning of period $ 82,634 $ 83,205 $ 5,663 $ 5,718
Service cost 3,488 3,091 246 260
Interest cost 6,450 5,683 448 396
Participant contributions 96 89
Benefits paid (3,765) (4,204) (159) (206)
Actuarial (gain) loss 8,532 (5,141) 445 (594)
Benefit obligation at the end of period $ 97,339 $ 82,634 $ 6,739 $ 5,663
Change in Plan Assets:
Fair value of plan assets at the
beginning of period $115,872 $102,550 $$
Actual return on plan assets 7,894 17,495
Employer contributions 41 31 63 117
Participant contributions 96 89
Benefits paid (3,765) (4,204) (159) (206)
Fair value of plan assets at the end of period $120,042 $115,872 $$
Reconciliation of Funded Status of the Plan:
Funded status at end of year $ 22,703 $ 33,238 $(6,739) $(5,663)
Unrecognized transition asset (642) (1,284)
Unrecognized prior service cost (1,849) (2,305) 65 83
Unrecognized actuarial (gain) loss 22,857 10,843 (371) (835)
Contributions for March to May 10 10 28 38
Prepaid (accrued) benefit costs $ 43,079 $ 40,502 $(7,017) $(6,377)
Components of the Consolidated Balance Sheets:
Prepaid benefit costs $ 45,624 $ 42,893 $$
Accrued benefit costs (2,545) (2,391) (7,017) (6,377)
Net asset (liability) recognized $ 43,079 $ 40,502 $(7,017) $(6,377)
(1) For plans with accumulated benefit obligations in excess of plan assets, the accumulated benefit obligation and plan assets were $2,781 and zero,
respectively, as of February 28, 2001, and $2,460 and zero, respectively, as of February 29, 2000.
35
2001
DARDEN RESTAURANTS
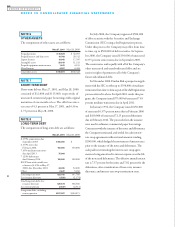
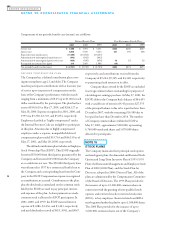
The following presents the weighted-average
assumptions used to determine the actuarial present
value of the defined benefit plans and the post-retire-
ment benefit plan obligations:
Defined Post-Retirement
Benefit Plans Benefit Plan
2001 2000 2001 2000
Discount rate 7.5% 8.0% 7.5% 8.0%
Expected long-term
rate of return on
plan assets 10.4% 10.4% N/A N/A
Rate of future
compensation
increases 4.0% 4.5% N/A N/A
The assumed health care cost trend rate increase in
the per-capita charges for benefits ranged from 6.0 per-
cent to 4.7 percent for 2002, depending on the medical
service category. The rates gradually decrease to a range
of 5.5 percent to 4.6 percent through 2006 and 2004,
respectively, and remain at that level thereafter.
The assumed health care cost trend rate has a signifi-
cant effect on amounts reported for retiree health care plans.
A one-percentage-point variance in the assumed health care
cost trend rate would increase or decrease the total of the
service and interest cost components of net periodic post-
retirement benefit cost by $146 and $111, respectively, and
would increase or decrease the accumulated post-retirement
benefit obligation by $1,298 and $1,036, respectively.