Pfizer 2005 Annual Report Download - page 57
Download and view the complete annual report
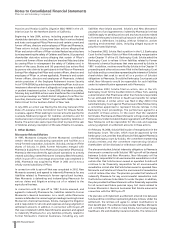
Please find page 57 of the 2005 Pfizer annual report below. You can navigate through the pages in the report by either clicking on the pages listed below, or by using the keyword search tool below to find specific information within the annual report.-
 1
1 -
2
-
3
-
4
-
5
-
6
-
7
-
8
-
9
-
10
-
11
-
12
-
13
-
14
-
15
-
16
-
17
-
18
-
19
-
20
-
21
-
22
-
23
-
24
-
25
-
26
-
27
-
28
-
29
-
30
-
31
-
32
-
33
-
34
-
35
-
36
-
37
-
38
-
39
-
40
-
41
-
42
-
43
-
44
-
45
-
46
-
 47
47 -
 48
48 -
 49
49 -
 50
50 -
 51
51 -
 52
52 -
 53
53 -
 54
54 -
 55
55 -
 56
56 -
 57
57 -
 58
58 -
 59
59 -
 60
60 -
 61
61 -
 62
62 -
 63
63 -
 64
64 -
 65
65 -
 66
66 -
 67
67 -
68
-
69
-
70
-
71
-
72
-
73
-
74
-
75
 |
 |

56 2005 Financial Report
Notes to Consolidated Financial Statements
Pfizer Inc and Subsidiary Companies
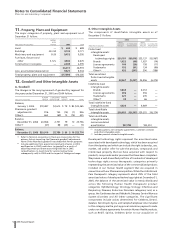
The increase in the 2005 international pension plans’ net periodic
benefit cost was largely driven by changes in assumptions used,
such as the decline in the discount rate and the expected return
on plan assets. The increase in the 2004 international pension
plans’ net periodic cost reflects the decline of the discount rate
assumption.
The decline in the 2004 U.S. qualified pension plans’ net periodic
benefit cost was largely driven by higher expected returns on plan
assets due to the 2003 voluntary tax-deductible contributions of
$1.4 billion and by higher than assumed 2003 investment returns,
partially offset by the decline in the discount rate assumed.
The net periodic benefit cost for the U.S. supplemental (non-
qualified) pension plans was $140 million in 2005, $131 million in
2004 and $127 million in 2003.
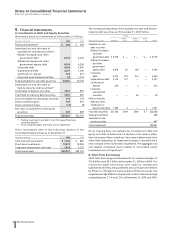
C. Actuarial Assumptions
The following table provides the weighted-average actuarial
assumptions:
(PERCENTAGES) 2005 2004 2003
Weighted-average assumptions used
to determine benefit obligations:
Discount rate:
U.S. qualified pension plans 5.8% 6.0% 6.3%
U.S. non-qualified pension plans 5.8 6.0 6.3
International pension plans 4.3 4.7 5.0
Postretirement plans 5.8 6.0 6.3
Rate of compensation increase:
U.S. qualified pension plans 4.5 4.5 4.5
U.S. non-qualified pension plans 4.5 4.5 4.5
International pension plans 3.6 3.6 3.6
Weighted-average assumptions used
to determine net benefit cost(a) :
Discount rate:
U.S. qualified pension plans 6.0 6.3 6.8
U.S. non-qualified pension plans 6.0 6.3 6.7
International pension plans 4.7 5.0 5.2
Postretirement plans 6.0 6.3 6.6
Expected return on plan assets:
U.S. qualified pension plans 9.0 9.0 9.0
International pension plans 6.9 7.3 7.0
Postretirement plans 9.0 9.0 9.0
Rate of compensation increase:
U.S. qualified pension plans 4.5 4.5 4.5
U.S. non-qualified pension plans 4.5 4.5 4.5
International pension plans 3.6 3.6 3.6
(a) The 2003 net benefit cost assumptions for legacy Pharmacia plans
were as of April 16, 2003.
The assumptions above are used to develop the benefit obligations
at fiscal year-end and to develop the net periodic benefit cost for
the subsequent fiscal year. Therefore, the assumptions used to
determine net periodic benefit cost for each year are established
at the end of each previous year, while the assumptions used to
determine benefit obligations were established at each year-end.
The net periodic benefit cost and the benefit obligations are
based on actuarial assumptions that are reviewed on an annual
basis. We revise these assumptions based on an annual evaluation
of long-term trends, as well as market conditions, that may have
an impact on the cost of providing retirement benefits.
The expected rate of return on plan assets for our U.S. qualified,
international and postretirement plans represents our long-term
assessment of return expectations, which we will change based
on significant shifts in economic and financial market conditions.
The 2005 expected rates of return for these plans reflect our
long-term outlook for a globally diversified portfolio which is
influenced by a combination of return expectations for individual
asset classes, actual historical experience and our diversified
investment strategy. The historical returns are one of the inputs
used to provide context for the development of our expectations
for future returns. Using this information, we develop ranges of
returns for each asset class and a weighted-average expected
return for our targeted portfolio, which includes the impact of
portfolio diversification and actively managed strategies.
The healthcare cost trend rate assumptions for our U.S.
postretirement benefit plans are as follows:
2005 2004
Healthcare cost trend rate assumed
for next year 9.8% 10.0%
Rate to which the cost trend rate is
assumed to decline 5.0 5.0
Year that the rate reaches the ultimate
trend rate 2013 2012
A one-percentage-point increase or decrease in the healthcare cost
trend rate assumed for postretirement benefits would have the
following effects as of December 31, 2005:
(MILLIONS OF DOLLARS) INCREASE DECREASE
Effect on total service and interest
cost components $ 17 $ (14)
Effect on postretirement benefit obligation 220 (187)