Pentax 2004 Annual Report Download - page 63
Download and view the complete annual report
Please find page 63 of the 2004 Pentax annual report below. You can navigate through the pages in the report by either clicking on the pages listed below, or by using the keyword search tool below to find specific information within the annual report.-
 1
1 -
2
-
3
-
4
-
5
-
6
-
7
-
8
-
9
-
10
-
11
-
12
-
13
-
14
-
15
-
16
-
17
-
18
-
19
-
20
-
21
-
22
-
23
-
24
-
25
-
26
-
27
-
28
-
29
-
30
-
31
-
32
-
33
-
34
-
35
-
36
-
37
-
38
-
39
-
40
-
41
-
42
-
43
-
44
-
45
-
46
-
47
-
48
-
49
-
50
-
51
-
52
-
 53
53 -
 54
54 -
 55
55 -
 56
56 -
 57
57 -
 58
58 -
 59
59 -
 60
60 -
 61
61 -
 62
62 -
 63
63 -
 64
64 -
 65
65 -
 66
66 -
 67
67 -
 68
68 -
 69
69 -
 70
70 -
 71
71 -
 72
72 -
 73
73 -
74
 |
 |
61
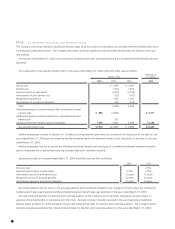
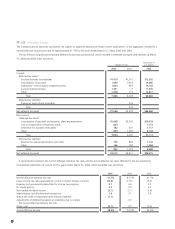
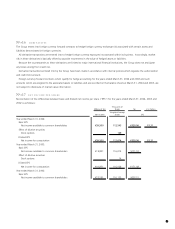
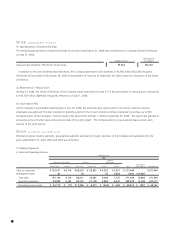
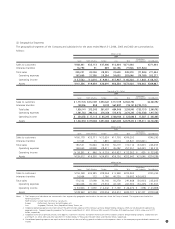
b. Assets, Depreciation, Loss on Impairment of Long-Lived Assets and Capital Expenditures
Millions of Yen
2004
Lifestyle
Information Technology Eye Care Refinement
Eliminations
Electro-Optics Photonics Vision Care Health Care Crystal Service Total and Corporate Consolidated
Assets ¥132,240 ¥1,748 ¥92,082 ¥18,873 ¥2,805 ¥2,797 ¥250,545 ¥39,342 ¥289,887
Depreciation 13,205 59 5,735 532 352 30 19,913 75 19,988
Loss on impairment of
long-lived assets 2,040 2,040 2,040
Capital expenditures 22,247 36 6,916 1,201 224 14 30,638 21 30,659
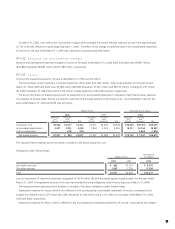
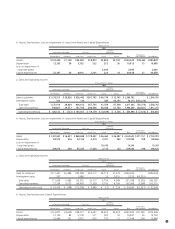
a. Sales and Operating Income
Thousands of U.S. Dollars
2004
Lifestyle
Information Technology Eye Care Refinement
Eliminations
Electro-Optics Photonics Vision Care Health Care Crystal Service Total and Corporate Consolidated
Sales to customers $
1,274,255
$38,830 $ 926,443 $ 267,745 $ 40,774 $ 12,745 $
2,560,792
$
2,560,792
Intersegment sales
764
170 585 54,755
56,274
$(56,274)
Total sales
1,275,019
38,830 926,613 267,745 41,359 67,500
2,617,066
(56,274)
2,560,792
Operating expenses
848,887
39,557 761,556 208,566 46,038 61,764
1,966,368
(48,661)
1,917,707
Operating income (loss) $
426,132
$(727) $165,057 $ 59,179 $ (4,679) $ 5,736 $
650,698
$(7,613) $
643,085
b. Assets, Depreciation, Loss on Impairment of Long-Lived Assets and Capital Expenditures
Thousands of U.S. Dollars
2004
Lifestyle
Information Technology Eye Care Refinement
Eliminations
Electro-Optics Photonics Vision Care Health Care Crystal Service Total and Corporate Consolidated
Assets $
1,247,547
$16,491 $ 868,698 $ 178,047 $ 26,462 $ 26,387 $
2,363,632
$371,151 $
2,734,783
Depreciation
124,575
556 54,104 5,019 3,321 283
187,858
708
188,566
Loss on impairment of
long-lived assets 19,245
19,245 19,245
Capital expenditures
209,878
340 65,245 11,330 2,113 132
289,038
198
289,236
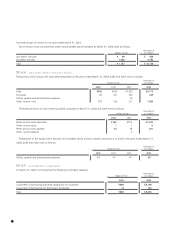
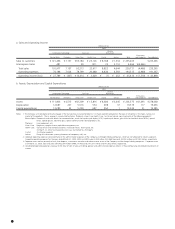
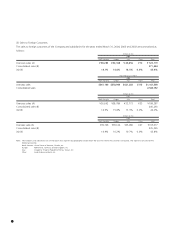
a. Sales and Operating Income
Millions of Yen
2003
Lifestyle
Information Technology Eye Care Refinement
Eliminations
Electro-Optics Photonics Vision Care Health Care Crystal Service Total and Corporate Consolidated
Sales to customers ¥111,461 ¥ 5,485 ¥94,388 ¥26,717 ¥6,719 ¥1,523 ¥246,293 ¥246,293
Intersegment sales 207 1,988 35 3,025 5,255 ¥(5,255)
Total sales 111,668 5,485 96,376 26,717 6,754 4,548 251,548 (5,255) 246,293
Operating expenses 77,254 6,073 80,978 21,628 6,766 4,309 197,008 (3,698) 193,310
Operating income (loss) ¥034,414 ¥ (588) ¥15,398 ¥05,089 ¥0,(12) ¥0,239 ¥054,540 ¥(1,557) ¥052,983
b. Assets, Depreciation and Capital Expenditures
Millions of Yen
2003
Lifestyle
Information Technology Eye Care Refinement
Eliminations
Electro-Optics Photonics Vision Care Health Care Crystal Service Total and Corporate Consolidated
Assets ¥114,877 ¥2,698 ¥98,077 ¥16,447 ¥8,409 ¥2,432 ¥242,940 ¥31,349 ¥
274,289
Depreciation 13,129 84 5,578 571 302 33 19,697 95
19,792
Capital expenditures 10,444 151 3,935 426 776 12 15,744 204 15,948