Pentax 2004 Annual Report Download - page 32
Download and view the complete annual report
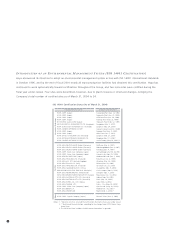
Please find page 32 of the 2004 Pentax annual report below. You can navigate through the pages in the report by either clicking on the pages listed below, or by using the keyword search tool below to find specific information within the annual report.-
 1
1 -
2
-
3
-
4
-
5
-
6
-
7
-
8
-
9
-
10
-
11
-
12
-
13
-
14
-
15
-
16
-
17
-
18
-
19
-
20
-
21
-
 22
22 -
 23
23 -
 24
24 -
 25
25 -
 26
26 -
 27
27 -
 28
28 -
 29
29 -
 30
30 -
 31
31 -
 32
32 -
 33
33 -
 34
34 -
 35
35 -
 36
36 -
 37
37 -
 38
38 -
 39
39 -
 40
40 -
 41
41 -
 42
42 -
43
-
44
-
45
-
46
-
47
-
48
-
49
-
50
-
51
-
52
-
53
-
54
-
55
-
56
-
57
-
58
-
59
-
60
-
61
-
62
-
63
-
64
-
65
-
66
-
67
-
68
-
69
-
70
-
71
-
72
-
73
-
74
 |
 |
30
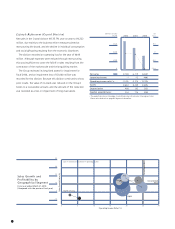
Scope of Consolidation
The Hoya Group (the "Group") includes Hoya Corporation and its
55 consolidated subsidiaries (six domestic and 49 overseas), as well
as five domestic affiliates, one of which is accounted for by the
equity method.
The number of consolidated subsidiaries increased by three
during the year under review. This was the net result of the
establishment of new companies, acquisition of companies and
reapportionment of voting rights that increased the number by
eight, while mergers into Hoya Corporation, liquidation and sales
of business reduced the number by five. The number of affiliates
decreased by one from the previous fiscal year, as one equity-
method affiliate became a consolidated subsidiary following
reapportionment of voting rights.
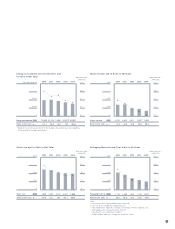
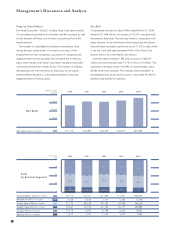
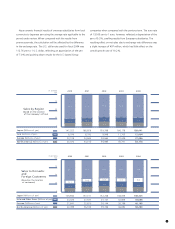
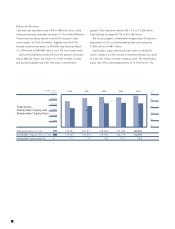
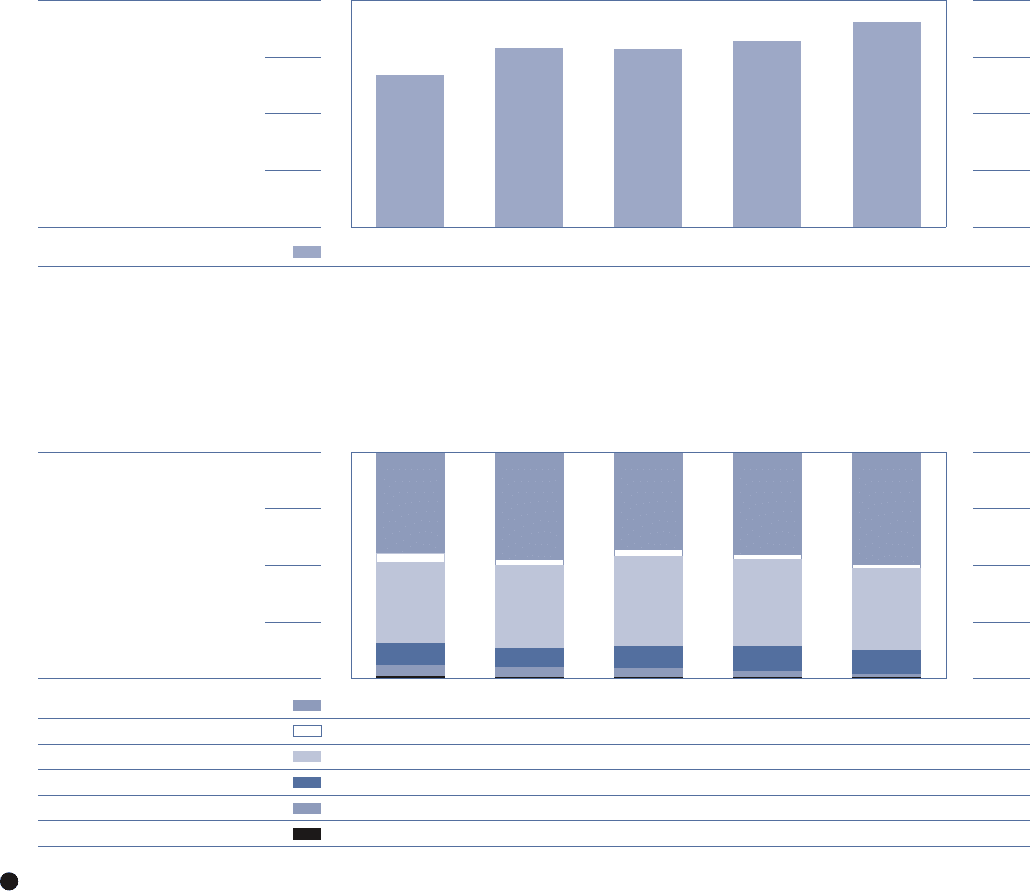
Net Sales
Consolidated net sales for fiscal 2004, ended March 31, 2004,
totaled ¥271,444 million, an increase of 10.2% compared with
the previous fiscal year. This was due mainly to rising sales in all
major divisions. In the Information Technology field, the Electro-
Optics division recorded a significant rise of 21.2% in sales, while
in the Eye Care field sales increased 4.0% in the Vision Care
division and 6.2% in the Health Care division.
Domestic sales increased 7.5% year on year to ¥148,325
million, and overseas sales rose 13.7% to ¥123,119 million. This
represents a domestic share of 54.6% of total net sales, and a
45.4% share from overseas. The overseas share increased 1.4
percentage points, as the previous year's ratios were 56.0% for
domestic and 44.0% for overseas.
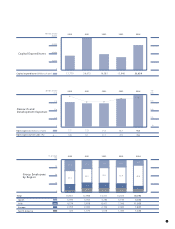
(% of total)
Sales
by Business Segment
Electro-Optics (Millions of yen)
Photonics (Millions of yen)
Vision Care (Millions of yen)
Health Care (Millions of yen)
Crystal (Millions of yen)
Service (Millions of yen)
100
75
50
25
0
135,071
4,116
98,203
28,381
4,322
1,351
49.8
1.5
36.2
10.4
1.6
0.5
90,174 112,341 101,496 111,461
7,248 6,534 7,157 5,485
71,754 86,198 93,184 94,388
19,541 20,130 23,106 26,717
10,516 9,942 8,788 6,719
1,877 1,657 1,534 1,523
44.9
3.6
35.7
9.7
5.2
0.9
45.3
2.2
38.3
10.9
2.7
0.6
43.1
3.1
39.6
9.8
3.7
0.7
47.4
2.8
36.4
8.5
4.2
0.7
200420032000 2001 2002
(Millions of yen)
Net Sales
Net sales (Millions of yen)
20042000 2001 2002 2003
300,000
225,000
150,000
75,000
0
271,444
201,110 236,802 235,265 246,293
Management’s Discussion and Analysis