Pentax 2004 Annual Report Download - page 31
Download and view the complete annual report
Please find page 31 of the 2004 Pentax annual report below. You can navigate through the pages in the report by either clicking on the pages listed below, or by using the keyword search tool below to find specific information within the annual report.-
 1
1 -
2
-
3
-
4
-
5
-
6
-
7
-
8
-
9
-
10
-
11
-
12
-
13
-
14
-
15
-
16
-
17
-
18
-
19
-
20
-
 21
21 -
 22
22 -
 23
23 -
 24
24 -
 25
25 -
 26
26 -
 27
27 -
 28
28 -
 29
29 -
 30
30 -
 31
31 -
 32
32 -
 33
33 -
 34
34 -
 35
35 -
 36
36 -
 37
37 -
 38
38 -
 39
39 -
 40
40 -
 41
41 -
42
-
43
-
44
-
45
-
46
-
47
-
48
-
49
-
50
-
51
-
52
-
53
-
54
-
55
-
56
-
57
-
58
-
59
-
60
-
61
-
62
-
63
-
64
-
65
-
66
-
67
-
68
-
69
-
70
-
71
-
72
-
73
-
74
 |
 |
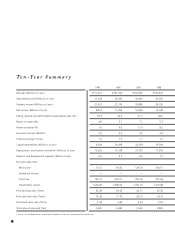
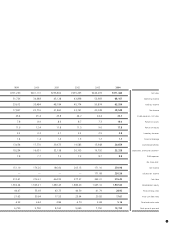
29
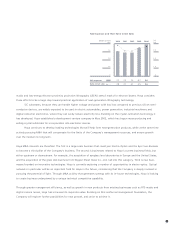
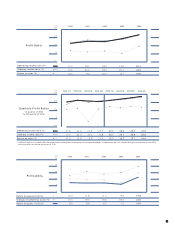
1999 2000 2001 2002 2003 2004
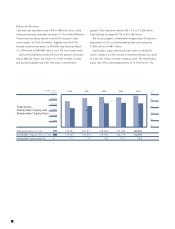
¥201,290 ¥201,110 ¥236,802 ¥235,265 ¥246,293 ¥271,444 Net sales
31,726 34,688 45,128 43,898 52,983 68,167 Operating income
33,612 35,484 48,184 45,774 50,874 65,554 Ordinary income
17,837 20,716 21,860 23,741 20,038 39,549 Net income
26.4 25.4 23.8 24.2 24.4 22.3 SG&A expenses / net sales
7.8 8.9 8.6 8.7 7.3 14.0 Return on assets
11.6 12.4 11.8 11.5 9.0 17.8 Return on equity
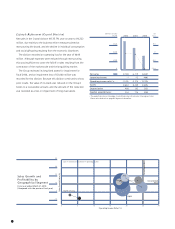
3.2 3.3 3.1 3.2 2.9 2.8 Inventory turnover
1.4 1.4 1.4 1.3 1.2 1.3 Financial leverage
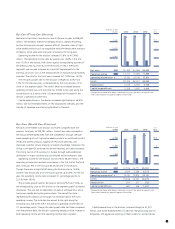
13,654 17,770 39,673 19,585 15,948 30,659 Capital expenditures
18,234 16,051 32,138 20,105 19,792 25,328
Depreciation, amortization and other*
7.8 7.7 7.3 7.3 8.7 9.8 R&D expenses
Per share data:
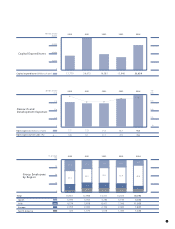
151.10 176.26 186.60 203.15 171.10 350.96 Net income
————171.08 350.56 Diluted net income
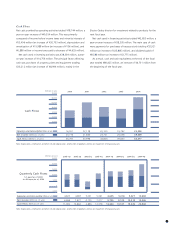
310.61 316.61 464.99 377.57 343.31 576.45 Cash flow
1,362.24 1,506.21 1,680.45 1,886.20 1,945.16 1,967.60 Shareholders’ equity
44.47 55.03 43.73 44.50 41.79 28.92 Price earnings ratio
21.63 30.64 17.55 23.94 20.83 17.61 Price cash flow ratio
4.93 6.44 4.86 4.79 3.68 5.16 Price book value ratio
6,720 9,700 8,160 9,040 7,150 10,150 Stock price at year-end