Pentax 2004 Annual Report Download - page 42
Download and view the complete annual report
Please find page 42 of the 2004 Pentax annual report below. You can navigate through the pages in the report by either clicking on the pages listed below, or by using the keyword search tool below to find specific information within the annual report.-
 1
1 -
2
-
3
-
4
-
5
-
6
-
7
-
8
-
9
-
10
-
11
-
12
-
13
-
14
-
15
-
16
-
17
-
18
-
19
-
20
-
21
-
22
-
23
-
24
-
25
-
26
-
27
-
28
-
29
-
30
-
31
-
 32
32 -
 33
33 -
 34
34 -
 35
35 -
 36
36 -
 37
37 -
 38
38 -
 39
39 -
 40
40 -
 41
41 -
 42
42 -
 43
43 -
 44
44 -
 45
45 -
 46
46 -
 47
47 -
 48
48 -
 49
49 -
 50
50 -
 51
51 -
 52
52 -
53
-
54
-
55
-
56
-
57
-
58
-
59
-
60
-
61
-
62
-
63
-
64
-
65
-
66
-
67
-
68
-
69
-
70
-
71
-
72
-
73
-
74
 |
 |
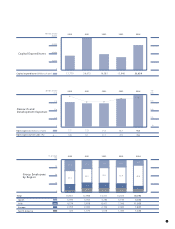
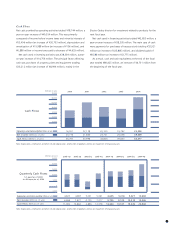
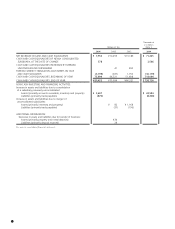
40
(Times)
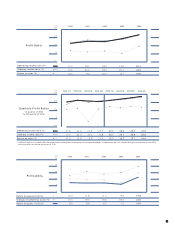
Stock Price Data
Price earnings ratio (Times)
Price cash flow ratio (Times)
Price book value ratio (Times)
Stock price at fiscal year-end (Yen)
(Yen)
100
60
80
40
20
0
28.92
17.61
5.16
10,150
55.03 43.73 44.50 41.79
30.64 17.55 23.94 20.83
6.44 4.86 4.79 3.68
9,700 8,160 9,040 7,150
12,000
9,600
4,800
2,400
0
7,200
20042003200220012000
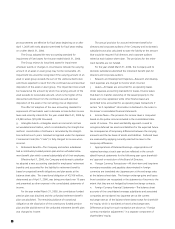
(Yen)
Dividend Per Share
Period-end dividend (Yen)
Interim dividend (Yen)
Total dividend (Yen)
100
60
80
20
40
0
50.00
50.00
100.00
19.00 30.00 25.00 25.00
16.00
35.00
20.00
50.00
25.00
50.00
25.00
50.00
20042003200220012000
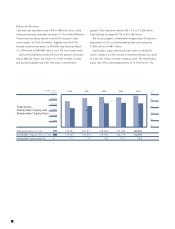
12,000
10,000
8,000
6,000
4,000
2,000
0
18,000
15,000
9,000
6,000
3,000
0
12,000
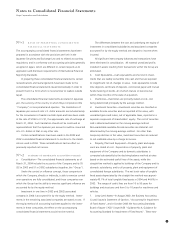
Stock price (Yen) FY2004
Common Stock Price Range
and Trading Volume
FY2003
Trading volume
(Thousands of shares)
(Month)
456789101112123456789101112123