Pentax 2004 Annual Report Download - page 41
Download and view the complete annual report
Please find page 41 of the 2004 Pentax annual report below. You can navigate through the pages in the report by either clicking on the pages listed below, or by using the keyword search tool below to find specific information within the annual report.-
 1
1 -
2
-
3
-
4
-
5
-
6
-
7
-
8
-
9
-
10
-
11
-
12
-
13
-
14
-
15
-
16
-
17
-
18
-
19
-
20
-
21
-
22
-
23
-
24
-
25
-
26
-
27
-
28
-
29
-
30
-
 31
31 -
 32
32 -
 33
33 -
 34
34 -
 35
35 -
 36
36 -
 37
37 -
 38
38 -
 39
39 -
 40
40 -
 41
41 -
 42
42 -
 43
43 -
 44
44 -
 45
45 -
 46
46 -
 47
47 -
 48
48 -
 49
49 -
 50
50 -
 51
51 -
52
-
53
-
54
-
55
-
56
-
57
-
58
-
59
-
60
-
61
-
62
-
63
-
64
-
65
-
66
-
67
-
68
-
69
-
70
-
71
-
72
-
73
-
74
 |
 |
39
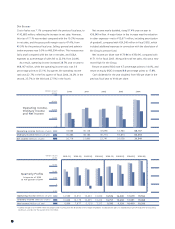
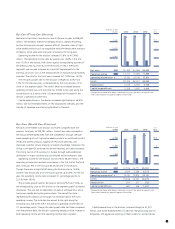
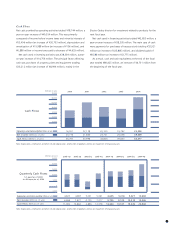
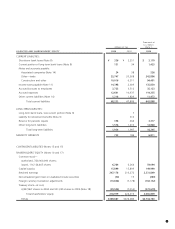
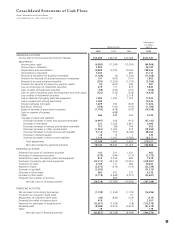
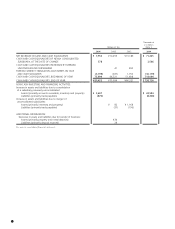
Cash Flows
Net cash provided by operating activities totaled ¥78,744 million, a
year-on-year increase of ¥40,354 million. This was primarily
composed of income before income taxes and minority interests of
¥55,496 million (an increase of ¥26,753 million), depreciation and
amortization of ¥19,988 million (an increase of ¥196 million), and
¥6,880 million in income taxes paid (a decrease of ¥4,629 million).
Net cash used in investing activities was ¥28,339 million, a year-
on-year increase of ¥14,756 million. The principal factor affecting
cash was purchases of property, plant and equipment totaling
¥23,212 million (an increase of ¥8,999 million), mainly in the
Electro-Optics division for investment related to products for the
next fiscal year.
Net cash used in financing activities totaled ¥42,853 million, a
year-on-year increase of ¥28,305 million. The main uses of cash
were payments for purchases of treasury stock totaling ¥32,921
million (an increase of ¥25,885 million), and dividends paid of
¥8,588 million (an increase of ¥2,775 million).
As a result, cash and cash equivalents at the end of the fiscal
year totaled ¥80,425 million, an increase of ¥4,731 million from
the beginning of the fiscal year.
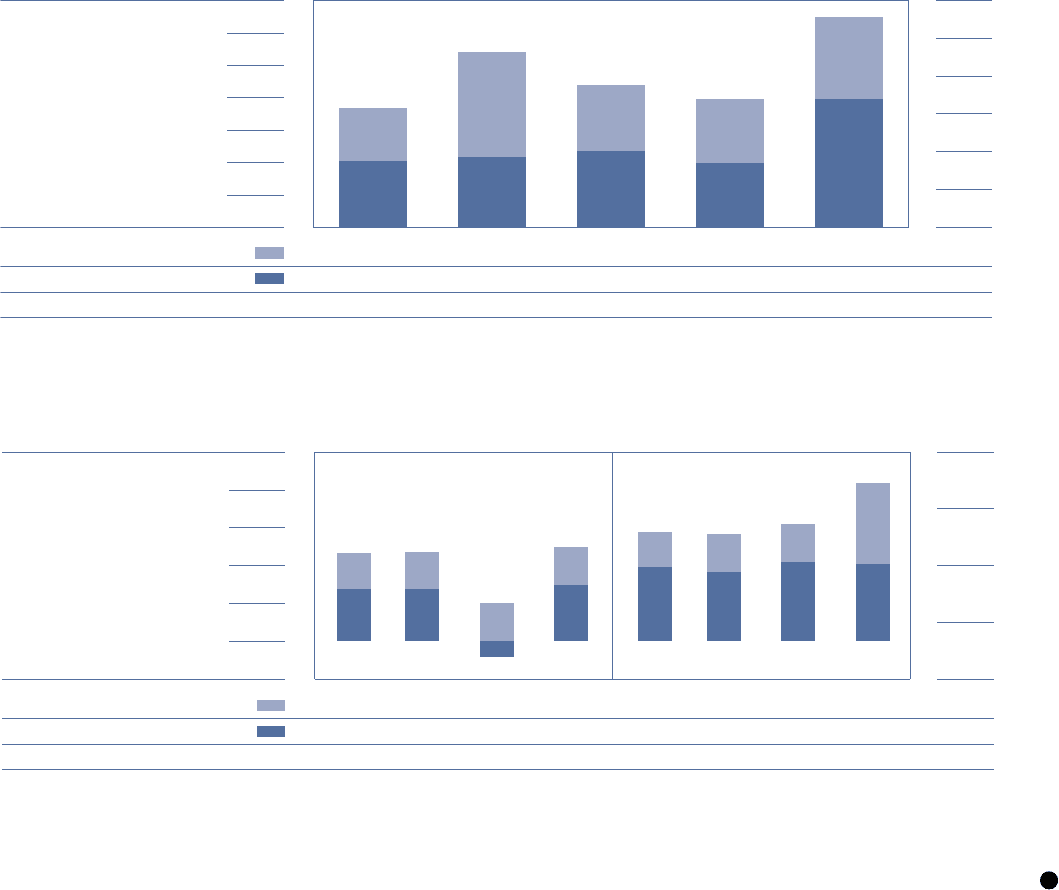
(Millions of yen)
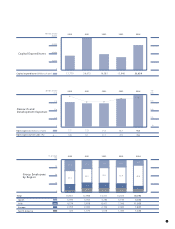
Quarterly Cash Flows
1st quarter of 2003
to 4th quarter of 2004
Depreciation, amortization and other (Millions of yen)
Net income (Millions of yen)
Cash flows (Millions of yen)
9,795
14,440
9,129
14,147
10,419
15,446
10,206
20,844
25,000
15,000
20,000
10,000
5,000
0
-5,000
5,0184,645 5,027 10,638
6,869
11,692
7,977
12,864
-2,125
2,896
7,317
12,378
4,8874,823 5,021 5,061
2004-4Q2004-3Q2004-2Q2004-1Q2003-4Q2003-3Q2003-2Q2003-1Q
(Millions of yen)
Cash Flows
Depreciation, amortization and other (Millions of yen)
Net income (Millions of yen)
Cash flows (Millions of yen)
70,000
40,000
50,000
60,000
30,000
20,000
10,000
0
25,328
39,549
64,877
16,051 32,138 20,105
23,741
43,846
20,716
36,767
21,860
53,998
19,792
20,038
39,830
20042003200220012000
Note: Depreciation, amortization and other includes depreciation, amortization of goodwill, and loss on impairment of long-leved assets.
Note: Depreciation, amortization and other includes depreciation, amortization of goodwill, and loss on impairment of long-leved assets.