Pentax 2004 Annual Report Download - page 35
Download and view the complete annual report
Please find page 35 of the 2004 Pentax annual report below. You can navigate through the pages in the report by either clicking on the pages listed below, or by using the keyword search tool below to find specific information within the annual report.-
 1
1 -
2
-
3
-
4
-
5
-
6
-
7
-
8
-
9
-
10
-
11
-
12
-
13
-
14
-
15
-
16
-
17
-
18
-
19
-
20
-
21
-
22
-
23
-
24
-
 25
25 -
 26
26 -
 27
27 -
 28
28 -
 29
29 -
 30
30 -
 31
31 -
 32
32 -
 33
33 -
 34
34 -
 35
35 -
 36
36 -
 37
37 -
 38
38 -
 39
39 -
 40
40 -
 41
41 -
 42
42 -
 43
43 -
 44
44 -
 45
45 -
46
-
47
-
48
-
49
-
50
-
51
-
52
-
53
-
54
-
55
-
56
-
57
-
58
-
59
-
60
-
61
-
62
-
63
-
64
-
65
-
66
-
67
-
68
-
69
-
70
-
71
-
72
-
73
-
74
 |
 |
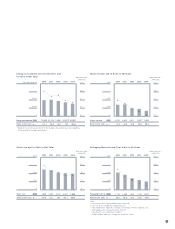
33
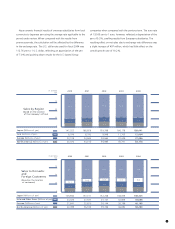
22.7
23.1
15.3
24.2
23.1
13.5
25.7
24.9
15.2
27.5
26.8
14.4
30.0
20.0
0
-10.0
10.0
20.6
17.7
11.2
22.6
23.0
12.9
21.8
20.2
-3.4*
21.1
21.8
11.9
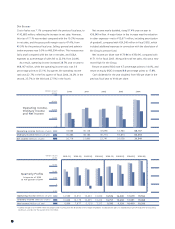
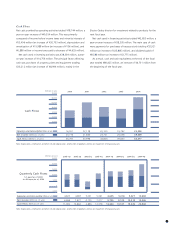
2004-4Q2004-3Q2004-2Q2004-1Q2003-4Q2003-3Q2003-2Q2003-1Q
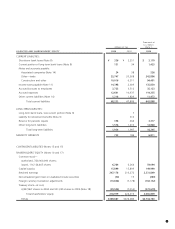
Operating income ratio (%)
Ordinary income ratio (%)
Return on sales (%)
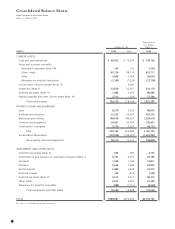
Quarterly Profit Ratios
1st quarter of 2003
to 4th quarter of 2004
(%)
* Additional expense of ¥14,949 million for compensation resulting from the dissolution of the Group’s employees’ funded pension plan was recorded during the third quarter of fiscal 2003,
resulting in return on sales for the quarter of -3.4%.
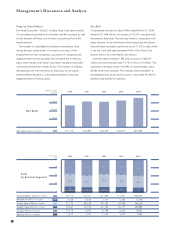
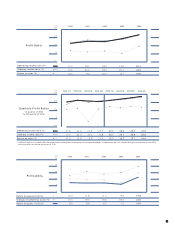
Operating income ratio (%)
Ordinary income ratio (%)
Return on sales (%)
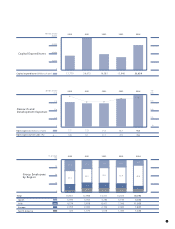
Profit Ratios
25.1
24.5
14.6
30.0
22.5
7.5
15.0
0
17.2
17.6
10.3
19.1
20.3
9.2
18.7
19.5
10.1
21.5
20.7
8.1
20042000 2001 2002 2003
(%)
30
18
24
12
6
0
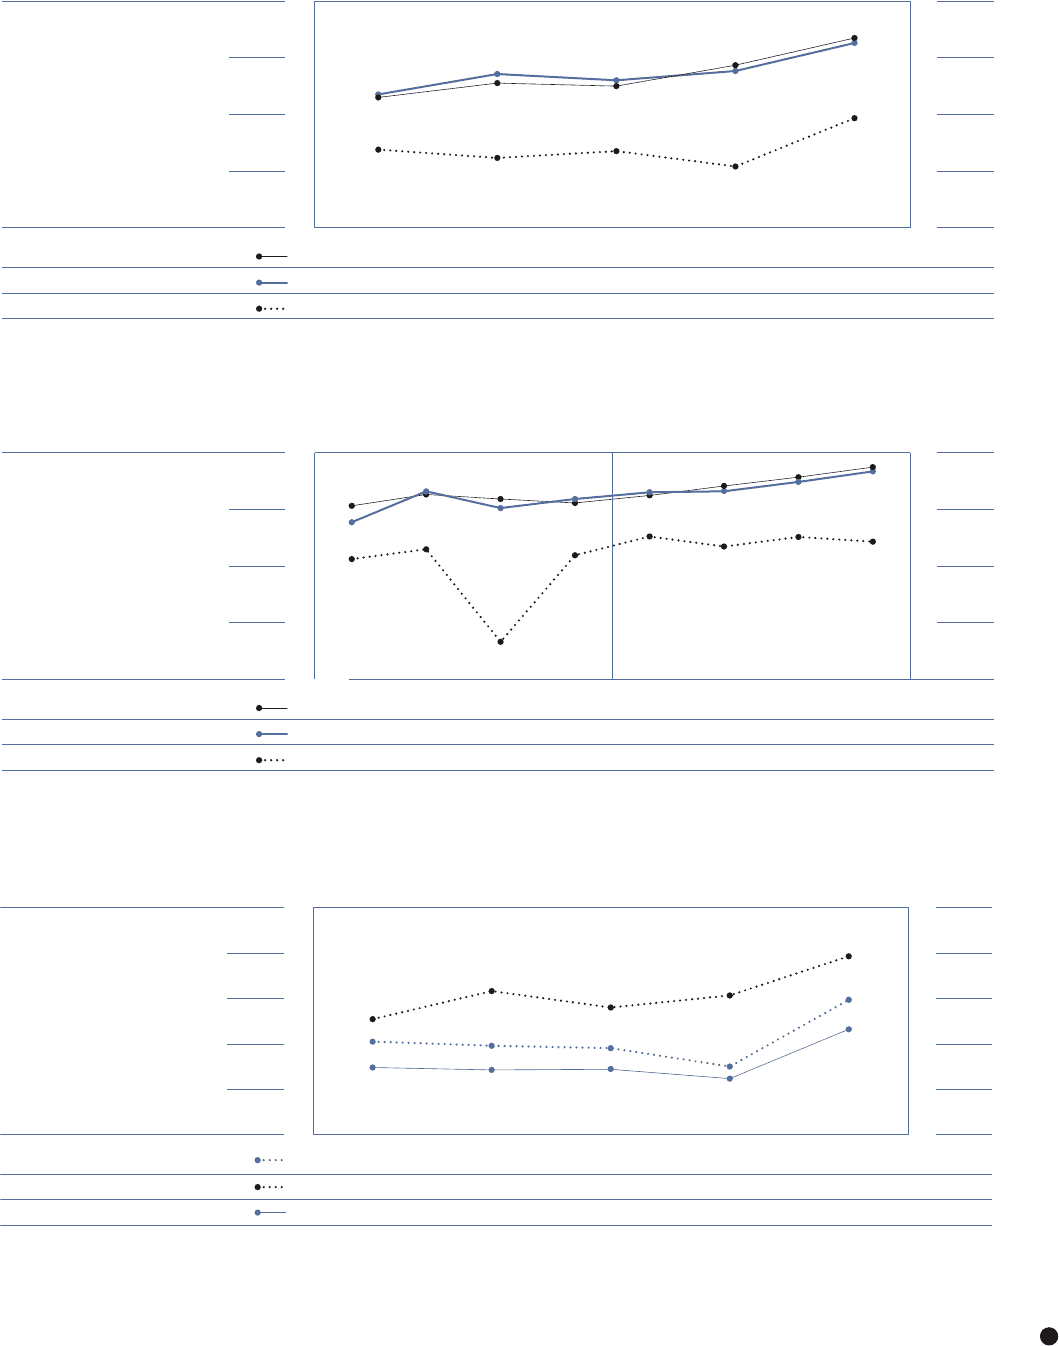
17.8
23.6
14.0
12.4 11.8 11.5 9.0
15.3 19.0 16.8 18.4
8.9 8.6 8.7 7.3
Return on equity [ROE](%)
Ordinary income/total assets (%)
Return on assets [ROA](%)
(%)
2004
Profitability
2003200220012000