Omron 2014 Annual Report Download - page 7
Download and view the complete annual report
Please find page 7 of the 2014 Omron annual report below. You can navigate through the pages in the report by either clicking on the pages listed below, or by using the keyword search tool below to find specific information within the annual report.-
 1
1 -
 2
2 -
 3
3 -
 4
4 -
 5
5 -
 6
6 -
 7
7 -
 8
8 -
 9
9 -
 10
10 -
 11
11 -
 12
12 -
 13
13 -
 14
14 -
 15
15 -
 16
16 -
 17
17 -
 18
18 -
19
-
20
-
21
-
22
-
23
-
24
-
25
-
26
-
27
-
28
-
29
-
30
-
31
-
32
-
33
-
34
-
35
-
36
-
37
-
38
-
39
-
40
-
41
-
42
-
43
-
44
-
45
-
46
-
47
-
48
-
49
-
50
-
51
 |
 |

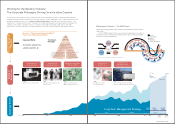
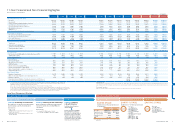
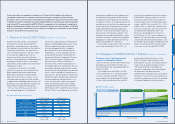
The dividend per share in fiscal
2013 marked an all-time high. The
shareholder return policy will be changed from
“a dividend payout
ratio of more than
25%” to a policy “targeting a dividend payout ratio
of
30%” by fiscal 2016.
–150
0
90
60
30
120
180
150
–60
–30
–90
–120
210
0
50
25
75
100
125
07 08 09 10 11 12 13
185.9
42
22.6%
106.4%
24.7%
37.6%
27.0% 25.3%
–132.2
25 16.0 17
121.7
30
74.5
28
137.2
37
53
209.8
Yen %
(FY)
EPS ¥
209.8
Earnings per share (EPS)
Dividends per share Dividend payout ratio (right scale)
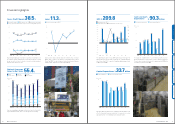
To realize the establishment of a“self-driven growth structure
”
priority will be given to the allocation of cash to growth investments.
This allocation is expected to amount to approximately ¥10 0
billion
over the three years to fiscal 2016.
0
50
75
25
100
07 08 09 10 11 12 13
18.2
40.640.6
53.0
46.646.6
36.6
51.751.7
45.5
74.774.7
18.8
45.345.3
5.6
0.5
55.755.7
90.3
90.3
Billions of yen
(FY)
Interest-bearing liabilities
Cash and cash equivalents
Although capital expenditures were temporarily decreased due to the
effects of global financial instability, the amounts invested
subsequently have exceeded depreciation and amortization.
0
20
30
10
40
07 08 09 10 11 12 13
37.1 36.3 36.8
33.5
27.0
19.5
23.2 23.0
28.3
22.6
28.3
22.5
25.1
33.7
(FY)
Depreciation and amortization
Capital expenditures
Billions of yen
Cash and Cash
Equivalents ¥
90.3
billion
Capital Expenditures
¥ 33.7 billion
Financial Highlights
8.6
0.9 2.5
7.8
6.5
7.0
8.8
0
20
10
40
30
50
07 08 09 10 11 12 13
38.4
38.4
23.1
34.834.8
26.2 25.4
23.0 23.5 23.4
6.7
7.7 7.2
6.7
6.8
6.7 6.2
23.5
35.135.1
37.537.5 36.836.8 37.137.1 38.538.5
% %
(FY)
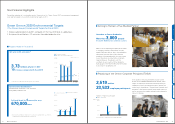
Improved profitability due to production automation and reduction in
the number of parts and materials contained in products. Looking
ahead, we will continue to allocate research and development
expenses at the
6%-to-7% level.
Each business division breaks down the elements that constitute
ROIC, aims to improve the quality of management through a
Down-Top ROIC Tree by setting each elements as key performance
indicator (KPIs), and promotes enhanced profitability.
Gross Profit Margin
38.5
%
Selling, general and administrative expenses ratio (excluding R&D expenses)
R&D expenses ratio Operating income margin
Gross profit margin
–10
0
5
10
–5
15
07 08 09 10 11 12 13
10.4
–7.6
1.0
7.8
4.8
8.6
11.3
(FY)
ROIC
11.3
%
Return on invested capital (ROIC)
0
400
200
800
600
07 08 09 10 11 12 13
763.0763.0
627.2627.2
524.7524.7
617.8617.8619.5619.5
650.5650.5
773.0773.0
47.9%
12.8%
50.3%
49.3%
12.0%
48.6%47.8%
12.1%12.4%
48.9%
44.6%
13.1%
6.1%
3.0%
12.0%12.0%14.7%15.7%16.3%16.3%
18.4%
17.6%
6.4%
2.0%1.9%1.6%1.5%
1.8%
2.0%
7.6%8.1%8.5%8.4%9.3%
13.4%
16.4%
11.7%
14.8%
13.7%13.5%12.4%
13.1%
Billions of yen
(FY)
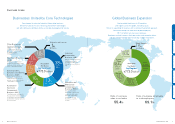
Sales are expanding in emerging countries, such as in the Asia Pacific
region and Greater China, where economic growth is continuing.
Japan Americas Europe
Direct Exports
Greater China Asia Pacific
Ratio of Overseas
Sales to Net Sales 55.4%
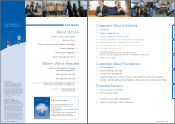
About Omron Where We’re Headed Corporate Value Initiatives Corporate Value Foundation Financial Section
10 Omron Corporation Integrated Report 2014 11