Omron 2014 Annual Report Download - page 21
Download and view the complete annual report
Please find page 21 of the 2014 Omron annual report below. You can navigate through the pages in the report by either clicking on the pages listed below, or by using the keyword search tool below to find specific information within the annual report.-
 1
1 -
2
-
3
-
4
-
5
-
6
-
7
-
8
-
9
-
10
-
 11
11 -
 12
12 -
 13
13 -
 14
14 -
 15
15 -
 16
16 -
 17
17 -
 18
18 -
 19
19 -
 20
20 -
 21
21 -
 22
22 -
 23
23 -
 24
24 -
 25
25 -
 26
26 -
 27
27 -
 28
28 -
 29
29 -
 30
30 -
 31
31 -
32
-
33
-
34
-
35
-
36
-
37
-
38
-
39
-
40
-
41
-
42
-
43
-
44
-
45
-
46
-
47
-
48
-
49
-
50
-
51
 |
 |

38 Omron Corporation Integrated Report 2014 39
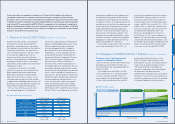
At a Glance
Industrial
Automation
Business
(IAB)
■
Net sales
■
Operating income / Operating income margin
■
Net sales
■
Operating income / Operating income margin
■
Net sales
■
Operating income / Operating income margin
■
Net sales
■
Operating income / Operating income margin
■
Net sales
■
Operating income / Operating income margin
■
Net sales
■
Operating income (loss) / Operating income margin
Electronic and
Mechanical
Components
Business
(EMC)
Automotive
Electronic
Components
Business
(AEC)
Social Systems,
Solutions
and Service
Business
(SSB)
Social Systems,
Solutions
and Service
Business
(SSB)
Healthcare
Business
(HCB)
Other
Businesses
0
150
200
250
300
100
50
10 11 12
300.0
291.7
263.0
270.8
271.9
13 14
(Forecast)
Billions of yen
(FY)
0
8
12
16
20
4
0
20
30
40
50
10
10 11 12
40.0
38.8
31.3
35.4
41.1
13 14
(Forecast)
%Billions of yen
0
4
6
8
10
2
0
2
6
4
8
(FY)
0
30
90
60
120
10 11 12
101.0
97.7
84.1
83.0
81.2
13 14
(Forecast)
Billions of yen
(FY)
0
4
8
12
0
3
6
9
12
10 11 12
9.2
8.7
4.4
5.1
9.0
13 14
(Forecast)
%Billions of yen
(FY)
13.3%
13.3%
11.9%
13.1%
15.1%
9.1%
8.9%
5.2%
6.2%
11.0%
0
60
30
90
120
10 11 12
128.5
126.6
97.6
85.0
84.3
13 14
(Forecast)
Billions of yen
(FY)
0
25
75
50
100
10 11 12
85.5
82.7
68.8
57.2
63.8
13 14
(Forecast)
Billions of yen
(FY) 10 11 12
6.5
5.6
2.9
0.1
1.7
13 14
(Forecast)
Billions of yen %
(FY)
0
4
2
6
8
10
0
6
3
9
12
10 11 12
9.2
9.1
5.0
2.7
4.2
13 14
(Forecast)
Billions of yen %
(FY)
7.2%
7.2%
5.1%
3.2%
4.9%
6.2%
4.7%
6.7%
7.6%
6.7%
4.2%
2.6%
0.2%
11.4%
11.0%
4.3%
0
25
75
50
100
10 11 12
98.5
89.3
71.5
62.4
60.6
13 14
(Forecast)
Billions of yen
(FY)
0
50
25
75
100
10 11 12
83.0
78.9
59.2
53.5
49.7
13 14
(Forecast)
Billions of yen
(FY)
0
4
2
8
6
10 11 12
8.0
7.5
4.4
2.9
4.1
13 14
(Forecast)
Billions of yen
0
6
3
12
9
%
(FY)
8.1%
8.5%
–2
0
2
4
6
8
10
–4
–610 11 12
9.5
8.7
2.5
–3.6
–4.7
13 14
(Forecast)
Billions of yen
0
6
12
%
(FY)
■
R&D expenses
■
Capital expenditures / Depreciation and amortization
■
R&D expenses
■
Capital expenditures / Depreciation and amortization
■
R&D expenses
■
Capital expenditures / Depreciation and amortization
■
R&D expenses
■
Capital expenditures / Depreciation and amortization
■
R&D expenses
■
Capital expenditures / Depreciation and amortization
■
R&D expenses
■
Capital expenditures / Depreciation and amortization
0
2
1
4
3
5
0
2
4
3
1
0
3.0
4.5
6.0
1.5
09 10 11 12 13
Billions of yen
(FY)
0
6
12
18
09 10 11 12 13
Billions of yen
(FY)
Depreciation and
amortization 3.6
CAPEX 3.3
3.5
2.8
4.2
3.8
4.5
2.2
5.2
1.9
0
6
9
12
3
09 10 11 12 13
Billions of yen
(FY)
Depreciation and
amortization 7.8
CAPEX 10.9
Depreciation and
amortization 3.4
CAPEX 6.7
Depreciation and
amortization 1.2
CAPEX 1.5
Depreciation and
amortization 2.3
CAPEX 3.9
Depreciation and
amortization 2.0
CAPEX 4.0
15.7
16.5
15.4
14.2
12.0
0
3.0
1.5
4.5
6.0
09 10 11 12 13
Billions of yen
(FY)
7.4
8.9
7.2
9.9
6.9
8.7
8.5
4.2
0
4
6
8
2
09 10 11 12 13
Billions of yen
(FY)
6.0
5.2
5.5
4.6
4.1
2.4
5.5
2.1
5.2
2.12.02.1
3.6
0
1.5
2.0
2.5
0.5
1.0
09 10 11 12 13
Billions of yen
(FY)
0
3
6
9
09 10 11 12 13
Billions of yen
(FY)
8.2
7.0
6.6
5.3
5.0
0
2
1
3
4
09 10 11 12 13
Billions of yen
(FY)
2.5
2.2
2.2
3.0
2.9
1.1
1.5
1.1
0.9
1.7
1.0
1.4
1.2
0
3
4
5
1
2
09 10 11 12 13
Billions of yen
(FY)
0
3.0
1.5
4.5
6.0
09 10 11 12 13
Billions of yen
(FY)
5.2
5.0
5.1
5.0
5.0
09 10 11 12 13
Billions of yen
(FY)
1.9
3.1
1.5
2.8
1.2
4.7
1.3
1.5
09 10 11 12 13
Billions of yen
(FY)
1.4
2.5
0.9
2.1
1.2
1.9
1.2
1.1
4.3
3.0
2.8
2.5
1.7
* From fiscal 2013, certain operations previously included in EMC have been included in IAB following a change in management categorizations.
Accordingly, the segment information figures for fiscal 2012 and prior fiscal years have been restated to reflect this change.
* Forecasts for fiscal 2014 are those disclosed on April 24, 2014.
* The sales figures given indicate sales to external customers and exclude intersegment transactions. Operating income indicates income including internal income
prior to the deduction of such amounts as intersegment transactions and head office expenses that are not apportionable.
* Forecasts for R&D expenses, depreciation and amortization, and capital expenditures are not publicized.
About Omron Where We’re Headed Corporate Value Initiatives Corporate Value Foundation Financial Section