Office Depot 2001 Annual Report Download - page 27
Download and view the complete annual report
Please find page 27 of the 2001 Office Depot annual report below. You can navigate through the pages in the report by either clicking on the pages listed below, or by using the keyword search tool below to find specific information within the annual report.-
 1
1 -
2
-
3
-
4
-
5
-
6
-
7
-
8
-
9
-
10
-
11
-
12
-
13
-
14
-
15
-
16
-
 17
17 -
 18
18 -
 19
19 -
 20
20 -
 21
21 -
 22
22 -
 23
23 -
 24
24 -
 25
25 -
 26
26 -
 27
27 -
 28
28 -
 29
29 -
 30
30 -
 31
31 -
 32
32 -
 33
33 -
 34
34 -
 35
35 -
 36
36 -
 37
37 -
38
-
39
-
40
-
41
-
42
-
43
-
44
-
45
-
46
-
47
-
48
-
49
-
50
-
51
-
52
-
53
-
54
-
55
-
56
 |
 |

25
the primary contribution to the fluctuation in pre-opening expenses over
the three years presented. For 2001, our pre-opening expenses approximated
$160,000 per domestic office supply store and $101,000 per international
office supply store. Our cost to open a new CSC varies significantly with
the size and location of the facility. We currently estimate costs to open a
domestic or international CSC to be $1.5 million per facility.
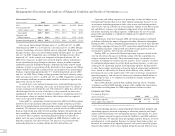
General and Administrative Expenses
(Dollars in thousands) 2001 2000 1999
General and administrative expenses $451,722 $453,784 $328,108
Percentage of sales 4.0% 3.9% 3.2%
Our general and administrative expenses primarily consist of personnel-
related costs associated with support functions. Because these functions, for
the most part, support all segments of our business, we do not consider these
costs in determining our segment profitability. Throughout 2000 and 1999,
we developed improvements in our infrastructure, particularly in the areas of
Supply Chain Management, MIS and International. These areas were signifi-
cant contributors to the increases in our general and administrative expenses
in those years. The primary benefits derived from this increased spending
were the expansion and improvement of our e-commerce services, a new data
center, improvements in our inventory in-stock positions and support for our
rapidly growing International Division. Also included in this category in 1999
are expenses relating to our CSC consolidation and integration initiatives.
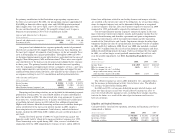
Other Income and Expense
(Dollars in thousands) 2001 2000 1999
Interest income $ 13,058 $ 11,502 $ 30,176
Interest expense (44,302) (33,901) (26,148)
Miscellaneous income (expense), net (9,057) 4,632 (3,514)
Financing and investing activities are not included in determining segment
profitability. During 2001, we issued $250 million of senior subordinated
notes that mature in 2008. We also entered into swap agreements to convert
these notes to a variable interest rate, to balance our fixed and variable inter-
est portfolio. Interest expense in 2001 reflects this additional borrowing.
Higher cash balances from this borrowing and increased cash flow from oper-
ations contributed to the increase in interest income in 2001, despite a
decreasing interest rate environment. Cash balances, and related interest
income, declined in 2000 from $300.8 million of cash used for purchases of
our stock.
During the fourth quarter of 2000, we began borrowing against our
domestic credit facility, which led to increased interest expense over 1999.
These borrowings were repaid during 2001. Also, reserves established in
connection with the 2000 comprehensive business review, and in 2001 for
future lease obligations related to our facility closures and merger activities,
are recorded at the net present value of the obligation. As we pay these obliga-
tions, the imputed interest cost on the discounted obligations is recognized
as interest expense. This has also caused interest expense to increase in 2000
compared to 1999 and should be expected to continue in future years.
Our net miscellaneous income (expense) consists of equity in the earn-
ings of our joint venture investments, royalty and franchise income that we
generate from licensing and franchise agreements and gains or impairments
on Internet investments. All of our equity investments involve operations
outside of the United States and Canada. Impairment charges for other than
temporary declines in value of certain Internet investments were $14.7 million
in 2001 and $45.5 million in 2000. Fiscal year 2000 also included a realized
gain of $57.9 million from the sale of certain Internet investments and $11.1
million of goodwill impairment in Japan. Under accounting rules that apply
in 2002, we will no longer record goodwill amortization, but will test each
year for possible impairment. See New Accounting Standards below.
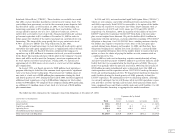
Income Taxes
(Dollars in thousands) 2001 2000 1999
Income Taxes $113,087 $43,127 $156,249
Effective income tax rate* 36.0% 46.6% 37.8%
Effective income tax rate*, excluding
merger and restructuring costs and
other one-time charges and credits 36.0% 37.0% 37.0%
*Income Taxes as a percentage of earnings before income taxes.
The effective income tax rate in 2001 declined to 36%, primarily reflect-
ing the increase in International activity taxed at lower rates. The effective
tax rate may decline further during 2002.
In 2000 and 1999, certain non-deductible merger-related charges and
other one-time charges caused our overall effective income tax rates to
rise. Our overall effective income tax rate, excluding these charges, may fluc-
tuate in the future as a result of the mix of pre-tax income and tax rates
between countries.
Liquidity and Capital Resources
Cash provided by (used in) our operating, investing and financing activities is
summarized as follows:
(Dollars in thousands) 2001 2000 1999
Operating activities $ 747,166 $ 316,482 $ 369,449
Investing activities (231,944) (239,365) (447,841)
Financing activities (85,403) (134,093) (405,849)