Office Depot 2001 Annual Report Download - page 22
Download and view the complete annual report
Please find page 22 of the 2001 Office Depot annual report below. You can navigate through the pages in the report by either clicking on the pages listed below, or by using the keyword search tool below to find specific information within the annual report.-
 1
1 -
2
-
3
-
4
-
5
-
6
-
7
-
8
-
9
-
10
-
11
-
 12
12 -
 13
13 -
 14
14 -
 15
15 -
 16
16 -
 17
17 -
 18
18 -
 19
19 -
 20
20 -
 21
21 -
 22
22 -
 23
23 -
 24
24 -
 25
25 -
 26
26 -
 27
27 -
 28
28 -
 29
29 -
 30
30 -
 31
31 -
 32
32 -
33
-
34
-
35
-
36
-
37
-
38
-
39
-
40
-
41
-
42
-
43
-
44
-
45
-
46
-
47
-
48
-
49
-
50
-
51
-
52
-
53
-
54
-
55
-
56
 |
 |

20
Office Depot, Inc.
Management’s Discussion and Analysis of Financial Condition and Results of Operations(continued)
In 2002, we plan to expand our International Division by opening 10 to 15
new retail stores in France and Japan, adding the European Business Service
Division to two new countries and launching service in Spain and Switzerland.
As part of the overall restructuring of our management team, all of our
European operations were consolidated under the leadership of Rolf van
Kaldekerken, who is President of our European business. Mr. van Kaldekerken
reports to our Chairman and CEO, Bruce Nelson. During 2001, we also changed
the management of our operations in Japan, and named Richard Lepley,
an experienced international retailer, as President of Office Depot Japan
and Viking Japan. Mr. Lepley reports directly to our Chairman and CEO,
Bruce Nelson.
Results of Operations
Fiscal 2001 was a year of improved operational performance across the Company
and increased overall earnings compared to 2000, even in the face of difficult
economic conditions and a decline in our consolidated sales. Diluted earnings
per share improved to $0.66 from $0.16 in 2000, and down from $0.69 in
1999. Fiscal year 2000 was adversely affected by charges associated with a
comprehensive business review that resulted in the closing of 70 retail stores,
the write-down of certain assets and the elimination of some employee posi-
tions. Additional store closure and impairment costs, the write-down of cer-
tain Internet investments, settlement of certain employee claims and gain on
the sale of our London warehouse were recognized in 2001. Without these
charges and credits, EPS was $0.79 in 2001 and $0.70 in 2000. See Charges
and Credits section below for additional discussions on these items.
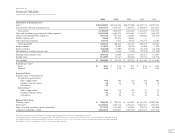
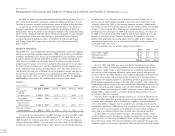
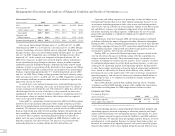
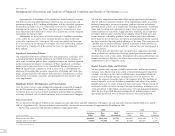
Overall
(Dollars in Millions) 2001 2000 1999
Sales $11,154.1 100.0% $11,569.7 100.0% $10,272.1 100.0%
Cost of goods
sold and
occupancy costs 7,984.0 71.6% 8,479.4 73.3% 7,450.6 72.5%
Gross profit 3,170.1 28.4% 3,090.3 26.7% 2,821.5 27.5%
Store and warehouse
operating and
selling expenses 2,343.4 21.0% 2,409.5 20.8% 2,023.1 19.7%
Store and warehouse
operating profit $ 826.7 7.4% $ 680.8 5.9% $ 798.4 7.8%
Our overall sales decreased 4% in 2001 and increased 13% in 2000, while
comparable sales decreased 2% in 2001 and grew 7% in 2000. Fiscal year
2000 included 53 weeks in accordance with our 52-53 week accounting con-
vention. Adjusting 2000 to a 52-week basis, sales decreased 2% in 2001. The
overall sales decrease in 2001 reflects a 10% decrease in our North American
Retail Division, a 4% increase in our Business Services Group and a 6%
increase in our International Division. Sales across the United States were
adversely affected in 2001 by the slowing domestic economy. Additionally,
the decline in sales of our North American Retail Division reflects our decision
to close 73 stores during 2001, following our comprehensive business review
performed in the latter part of 2000. The largest percentage sales increases
in 2000 were realized in our BSG segment, driven most significantly by the
growth in our contract and Internet businesses. E-commerce sales have
improved in all periods, increasing almost 60% in 2001 to $1.6 billion. Also
contributing significantly to our sales growth in 2000 was the continued
expansion of our store base.
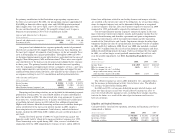
Our worldwide sales by product group were as follows:
2001 2000 1999
General office supplies 44.2% 41.7% 41.0%
Technology products 46.3% 47.5% 47.5%
Office furniture 9.5% 10.8% 11.5%
100.0% 100.0% 100.0%
In both 2001 and 2000, our sales mix shifted toward our core office
supply items. Sales of technology products decreased significantly in 2001,
reflecting to a large extent, a general slowing of technology-related product
sales in the overall economy. Moreover, many more general and specialty
retailers outside the office products retail segment (including discount retail-
ers, drug store chains and warehouse club retailers) have broadened their
assortments of technology products. Technology products generally have lower
profit margins compared to many of the core office supplies. Also, within the
technology products category, the mix shifted from technology hardware and
software towards machine supplies. Sales of office furniture declined, reflect-
ing lower volume and unit prices in 2001 and lower average selling prices
during 2000, as many business customers deferred large purchases because
of concerns about the economy.
Our overall gross profit percentages fluctuate as a result of numerous fac-
tors, including competitive pricing pressures; changes in product, catalog and
customer mix; emergence of new technology; suppliers’ pricing changes; as
well as our ability to improve our net product costs through growth in total
merchandise purchases. Additionally, our occupancy costs may vary as we add
stores and CSCs in new markets with different rental and other occupancy
costs, and as we relocate and/or close existing stores in current markets.
In mid-2000, we reduced prices for paper and machine supplies across
all of our domestic sales channels in response to competitive pressures from
discount clubs and other non-traditional sellers of those supply items. These
price reductions, along with increased product costs, primarily for paper and
machine supplies, had the most significant effect on our decreased gross profit